US Airways 2005 Annual Report Download - page 17
Download and view the complete annual report
Please find page 17 of the 2005 US Airways annual report below. You can navigate through the pages in the report by either clicking on the pages listed below, or by using the keyword search tool below to find specific information within the annual report.-
 1
1 -
2
-
3
-
4
-
5
-
6
-
 7
7 -
 8
8 -
 9
9 -
 10
10 -
 11
11 -
 12
12 -
 13
13 -
 14
14 -
 15
15 -
 16
16 -
 17
17 -
 18
18 -
 19
19 -
 20
20 -
 21
21 -
 22
22 -
 23
23 -
 24
24 -
 25
25 -
 26
26 -
 27
27 -
28
-
29
-
30
-
31
-
32
-
33
-
34
-
35
-
36
-
37
-
38
-
39
-
40
-
41
-
42
-
43
-
44
-
45
-
46
-
47
-
48
-
49
-
50
-
51
-
52
-
53
-
54
-
55
-
56
-
57
-
58
-
59
-
60
-
61
-
62
-
63
-
64
-
65
-
66
-
67
-
68
-
69
-
70
-
71
-
72
-
73
-
74
-
75
-
76
-
77
-
78
-
79
-
80
-
81
-
82
-
83
-
84
-
85
-
86
-
87
-
88
-
89
-
90
-
91
-
92
-
93
-
94
-
95
-
96
-
97
-
98
-
99
-
100
-
101
-
102
-
103
-
104
-
105
-
106
-
107
-
108
-
109
-
110
-
111
-
112
-
113
-
114
-
115
-
116
-
117
-
118
-
119
-
120
-
121
-
122
-
123
-
124
-
125
-
126
-
127
-
128
-
129
-
130
-
131
-
132
-
133
-
134
-
135
-
136
-
137
-
138
-
139
-
140
-
141
-
142
-
143
-
144
-
145
-
146
-
147
-
148
-
149
-
150
-
151
-
152
-
153
-
154
-
155
-
156
-
157
-
158
-
159
-
160
-
161
-
162
-
163
-
164
-
165
-
166
-
167
-
168
-
169
-
170
-
171
-
172
-
173
-
174
-
175
-
176
-
177
-
178
-
179
-
180
-
181
-
182
-
183
-
184
-
185
-
186
-
187
-
188
-
189
-
190
-
191
-
192
-
193
-
194
-
195
-
196
-
197
-
198
-
199
-
200
-
201
-
202
-
203
-
204
-
205
-
206
-
207
-
208
-
209
-
210
-
211
-
212
-
213
-
214
-
215
-
216
-
217
-
218
-
219
-
220
-
221
-
222
-
223
-
224
-
225
-
226
-
227
-
228
-
229
-
230
-
231
-
232
-
233
-
234
-
235
-
236
-
237
-
238
-
239
-
240
-
241
-
242
-
243
-
244
-
245
-
246
-
247
-
248
-
249
-
250
-
251
-
252
-
253
-
254
-
255
-
256
-
257
-
258
-
259
-
260
-
261
-
262
-
263
-
264
-
265
-
266
-
267
-
268
-
269
-
270
-
271
-
272
-
273
-
274
-
275
-
276
-
277
-
278
-
279
-
280
-
281
-
282
-
283
-
284
-
285
-
286
-
287
-
288
-
289
-
290
-
291
-
292
-
293
-
294
-
295
-
296
-
297
-
298
-
299
-
300
-
301
-
302
-
303
-
304
-
305
-
306
-
307
-
308
-
309
-
310
-
311
-
312
-
313
-
314
-
315
-
316
-
317
-
318
-
319
-
320
-
321
-
322
-
323
 |
 |

Table of Contents
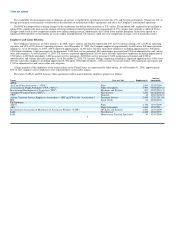
Aviation Fuel
Aviation fuel has historically been the Company's second largest expense, but in 2005, aviation fuel was the largest expense. The average cost of a gallon
of aviation fuel increased 33% from 2004 to 2005. Because the operations of the airlines are dependent upon aviation fuel, increases in aviation fuel costs
could materially and adversely affect liquidity, results of operations and financial condition.
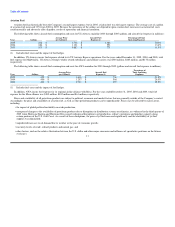
The following table shows aircraft fuel consumption and costs for US Airways mainline 2003 through 2005 (gallons and aircraft fuel expense in millions):
Average Price Aircraft Fuel Percentage of Total
Year Gallons per Gallon(1) Expense(1) Operating Expenses
2005 842 $ 1.766 $ 1,486 20.0%
2004 884 $ 1.121 $ 991 13.4%
2003 873 $ 0.883 $ 771 11.0%
(1) Includes fuel taxes and the impact of fuel hedges.
In addition, US Airways incurs fuel expense related to its US Airways Express operations. For the years ended December 31, 2005, 2004, and 2003, total
fuel expense for MidAtlantic, US Airways Group's wholly owned subsidiaries and affiliate carriers was $504 million, $285 million, and $170 million
respectively.
The following table shows aircraft fuel consumption and costs for AWA mainline for 2003 through 2005 (gallons and aircraft fuel expense in millions):
Percentage of
Average Price Aircraft Fuel Total Operating
Year Gallons per Gallon(1) Expense(1) Expenses
2005 450 $ 1.636 $ 736 21.8%
2004 450 $ 1.257 $ 566 20.5%
2003 423 $ 0.930 $ 393 15.5%
(1) Includes fuel taxes and the impact of fuel hedges.
In addition, AWA incurs fuel expense for its regional airline alliance with Mesa. For the years ended December 31, 2005, 2004 and 2003, total fuel
expense for the Mesa alliance was $182 million, $102 million and $61 million, respectively.
Prices and availability of all petroleum products are subject to political, economic and market factors that are generally outside of the Company's control.
Accordingly, the price and availability of aviation fuel, as well as other petroleum products can be unpredictable. Prices may be affected by many factors,
including:
• the impact of global political instability on crude production;
• unexpected changes to the availability of petroleum products due to disruptions in distribution systems or refineries, as evidenced in the third quarter of
2005 when Hurricane Katrina and Hurricane Rita caused widespread disruption to oil production, refinery operations and pipeline capacity along
certain portions of the U.S. Gulf Coast. As a result of these disruptions, the price of jet fuel increased significantly and the availability of jet fuel
supplies was diminished;
• unpredicted increases to oil demand due to weather or the pace of economic growth;
• inventory levels of crude, refined products and natural gas; and
• other factors, such as the relative fluctuation between the U.S. dollar and other major currencies and influence of speculative positions on the futures
exchanges. 11