US Airways 2005 Annual Report Download - page 140
Download and view the complete annual report
Please find page 140 of the 2005 US Airways annual report below. You can navigate through the pages in the report by either clicking on the pages listed below, or by using the keyword search tool below to find specific information within the annual report.-
 1
1 -
2
-
3
-
4
-
5
-
6
-
7
-
8
-
9
-
10
-
11
-
12
-
13
-
14
-
15
-
16
-
17
-
18
-
19
-
20
-
21
-
22
-
23
-
24
-
25
-
26
-
27
-
28
-
29
-
30
-
31
-
32
-
33
-
34
-
35
-
36
-
37
-
38
-
39
-
40
-
41
-
42
-
43
-
44
-
45
-
46
-
47
-
48
-
49
-
50
-
51
-
52
-
53
-
54
-
55
-
56
-
57
-
58
-
59
-
60
-
61
-
62
-
63
-
64
-
65
-
66
-
67
-
68
-
69
-
70
-
71
-
72
-
73
-
74
-
75
-
76
-
77
-
78
-
79
-
80
-
81
-
82
-
83
-
84
-
85
-
86
-
87
-
88
-
89
-
90
-
91
-
92
-
93
-
94
-
95
-
96
-
97
-
98
-
99
-
100
-
101
-
102
-
103
-
104
-
105
-
106
-
107
-
108
-
109
-
110
-
111
-
112
-
113
-
114
-
115
-
116
-
117
-
118
-
119
-
120
-
121
-
122
-
123
-
124
-
125
-
126
-
127
-
128
-
129
-
 130
130 -
 131
131 -
 132
132 -
 133
133 -
 134
134 -
 135
135 -
 136
136 -
 137
137 -
 138
138 -
 139
139 -
 140
140 -
 141
141 -
 142
142 -
 143
143 -
 144
144 -
 145
145 -
 146
146 -
 147
147 -
 148
148 -
 149
149 -
 150
150 -
151
-
152
-
153
-
154
-
155
-
156
-
157
-
158
-
159
-
160
-
161
-
162
-
163
-
164
-
165
-
166
-
167
-
168
-
169
-
170
-
171
-
172
-
173
-
174
-
175
-
176
-
177
-
178
-
179
-
180
-
181
-
182
-
183
-
184
-
185
-
186
-
187
-
188
-
189
-
190
-
191
-
192
-
193
-
194
-
195
-
196
-
197
-
198
-
199
-
200
-
201
-
202
-
203
-
204
-
205
-
206
-
207
-
208
-
209
-
210
-
211
-
212
-
213
-
214
-
215
-
216
-
217
-
218
-
219
-
220
-
221
-
222
-
223
-
224
-
225
-
226
-
227
-
228
-
229
-
230
-
231
-
232
-
233
-
234
-
235
-
236
-
237
-
238
-
239
-
240
-
241
-
242
-
243
-
244
-
245
-
246
-
247
-
248
-
249
-
250
-
251
-
252
-
253
-
254
-
255
-
256
-
257
-
258
-
259
-
260
-
261
-
262
-
263
-
264
-
265
-
266
-
267
-
268
-
269
-
270
-
271
-
272
-
273
-
274
-
275
-
276
-
277
-
278
-
279
-
280
-
281
-
282
-
283
-
284
-
285
-
286
-
287
-
288
-
289
-
290
-
291
-
292
-
293
-
294
-
295
-
296
-
297
-
298
-
299
-
300
-
301
-
302
-
303
-
304
-
305
-
306
-
307
-
308
-
309
-
310
-
311
-
312
-
313
-
314
-
315
-
316
-
317
-
318
-
319
-
320
-
321
-
322
-
323
 |
 |

Table of Contents
US Airways Group, Inc.
Notes to Consolidated Financial Statements — (Continued)
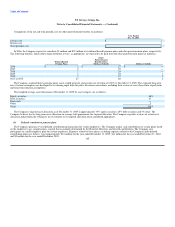
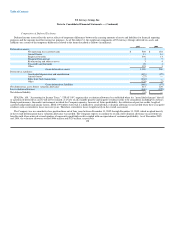
The following table presents the weighted average assumptions used to determine benefit obligations:
Other
Defined Benefit Postretirement
Pension Plans Benefits
Year Ended Year Ended
Dec. 31, 2005 Dec. 31, 2005
Discount rate 5.75% 5.30%
Rate of compensation increase 4.00% 4.00%
As of December 31, 2005, the Company discounted its pension obligations using a rate of 5.75% based on the current rates earned on long-term bonds that
received one of the two highest ratings given by a recognized rating agency.
At the measurement date of September 30, 2005, the Company assumed a discount rate of 5.30% for measuring its other postretirement benefit
obligations, based on a hypothetical portfolio of high quality publicly traded U.S. bonds (Aa rated, non-callable or callable with make-whole provisions), for
which the timing and cash outflows approximate the estimated benefit payments of the other postretirement benefit plans.
The assumed health care cost trend rates are 10% in 2006 and 9% in 2007, decreasing to 5% in 2011 and thereafter. The assumed health care cost trend
rates have a significant effect on amounts reported for retiree health care plans. A one-percentage point change in the health care cost trend rates would have
the following effects on other postretirement benefits as of September 30, 2005 (in millions):
1% Increase 1% Decrease
Effect on total service and interest costs $ 1 $ —
Effect on postretirement benefit obligation $ 10 $ (9)
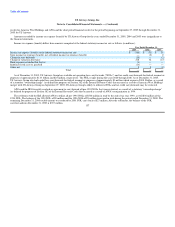
Weighted average assumptions used to determine net periodic benefit cost were as follows:
Other
Defined Benefit Postretirement
Pension Plans Benefits
Year Ended Year Ended
Dec. 31, 2005 Dec. 31, 2005
Discount rate 5.75% 5.30%
Expected return on plan assets 8.00% —
Rate of compensation increase 4.00% 4.00%
Components of the net and total periodic cost for pension benefits (in millions):
Year Ended
Dec. 31, 2005
Service cost $ —
Interest cost 1
Expected return on plan assets (1)
Total periodic cost $ —
134