US Airways 2005 Annual Report Download - page 104
Download and view the complete annual report
Please find page 104 of the 2005 US Airways annual report below. You can navigate through the pages in the report by either clicking on the pages listed below, or by using the keyword search tool below to find specific information within the annual report.-
 1
1 -
2
-
3
-
4
-
5
-
6
-
7
-
8
-
9
-
10
-
11
-
12
-
13
-
14
-
15
-
16
-
17
-
18
-
19
-
20
-
21
-
22
-
23
-
24
-
25
-
26
-
27
-
28
-
29
-
30
-
31
-
32
-
33
-
34
-
35
-
36
-
37
-
38
-
39
-
40
-
41
-
42
-
43
-
44
-
45
-
46
-
47
-
48
-
49
-
50
-
51
-
52
-
53
-
54
-
55
-
56
-
57
-
58
-
59
-
60
-
61
-
62
-
63
-
64
-
65
-
66
-
67
-
68
-
69
-
70
-
71
-
72
-
73
-
74
-
75
-
76
-
77
-
78
-
79
-
80
-
81
-
82
-
83
-
84
-
85
-
86
-
87
-
88
-
89
-
90
-
91
-
92
-
93
-
 94
94 -
 95
95 -
 96
96 -
 97
97 -
 98
98 -
 99
99 -
 100
100 -
 101
101 -
 102
102 -
 103
103 -
 104
104 -
 105
105 -
 106
106 -
 107
107 -
 108
108 -
 109
109 -
 110
110 -
 111
111 -
 112
112 -
 113
113 -
 114
114 -
115
-
116
-
117
-
118
-
119
-
120
-
121
-
122
-
123
-
124
-
125
-
126
-
127
-
128
-
129
-
130
-
131
-
132
-
133
-
134
-
135
-
136
-
137
-
138
-
139
-
140
-
141
-
142
-
143
-
144
-
145
-
146
-
147
-
148
-
149
-
150
-
151
-
152
-
153
-
154
-
155
-
156
-
157
-
158
-
159
-
160
-
161
-
162
-
163
-
164
-
165
-
166
-
167
-
168
-
169
-
170
-
171
-
172
-
173
-
174
-
175
-
176
-
177
-
178
-
179
-
180
-
181
-
182
-
183
-
184
-
185
-
186
-
187
-
188
-
189
-
190
-
191
-
192
-
193
-
194
-
195
-
196
-
197
-
198
-
199
-
200
-
201
-
202
-
203
-
204
-
205
-
206
-
207
-
208
-
209
-
210
-
211
-
212
-
213
-
214
-
215
-
216
-
217
-
218
-
219
-
220
-
221
-
222
-
223
-
224
-
225
-
226
-
227
-
228
-
229
-
230
-
231
-
232
-
233
-
234
-
235
-
236
-
237
-
238
-
239
-
240
-
241
-
242
-
243
-
244
-
245
-
246
-
247
-
248
-
249
-
250
-
251
-
252
-
253
-
254
-
255
-
256
-
257
-
258
-
259
-
260
-
261
-
262
-
263
-
264
-
265
-
266
-
267
-
268
-
269
-
270
-
271
-
272
-
273
-
274
-
275
-
276
-
277
-
278
-
279
-
280
-
281
-
282
-
283
-
284
-
285
-
286
-
287
-
288
-
289
-
290
-
291
-
292
-
293
-
294
-
295
-
296
-
297
-
298
-
299
-
300
-
301
-
302
-
303
-
304
-
305
-
306
-
307
-
308
-
309
-
310
-
311
-
312
-
313
-
314
-
315
-
316
-
317
-
318
-
319
-
320
-
321
-
322
-
323
 |
 |

Table of Contents
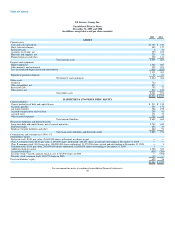
US Airways Group, Inc.
Consolidated Balance Sheets
December 31, 2005 and 2004
(in millions, except share and per share amounts)
2005 2004
ASSETS
Current assets
Cash and cash equivalents $1,125 $ 149
Short-term investments 452 127
Restricted cash 8 41
Accounts receivable, net 353 109
Materials and supplies, net 229 58
Prepaid expenses and other 392 141
Total current assets 2,559 625
Property and equipment
Flight equipment 1,920 927
Other property and equipment 532 291
Less accumulated depreciation and amortization (431) (625)
2,021 593
Equipment purchase deposits 43 63
Net property and equipment 2,064 656
Other assets
Goodwill 732 —
Other intangibles, net 583 —
Restricted cash 792 72
Other assets, net 234 122
Total other assets 2,341 194
$6,964 $1,475
LIABILITIES & STOCKHOLDERS' EQUITY
Current liabilities
Current maturities of debt and capital leases $ 211 $ 155
Accounts payable 530 174
Air traffic liability 788 195
Accrued compensation and vacation 209 43
Accrued taxes 171 33
Other accrued expenses 750 65
Total current liabilities 2,659 665
Noncurrent liabilities and deferred credits
Long-term debt and capital leases, net of current maturities 2,749 640
Deferred credits 254 43
Employee benefit liabilities and other 882 91
Total noncurrent liabilities and deferred credits 3,885 774
Commitments and contingencies (Note 12)
Stockholders' equity
Preferred stock, $0.01 par value; 48,800,000 shares authorized, no shares issued — —
Class A common stock, $0.01 par value; 1,200,000 shares authorized, 460,657 shares issued and outstanding at December 31, 2004 — —
Class B common stock, $0.01 par value; 100,000,000 shares authorized, 21,270,506 shares issued and outstanding at December 31, 2004 — 1
Common stock, $0.01 par value; 200,000,000 shares authorized, 81,664,005 shares outstanding at December 31, 2005 1 —
Additional paid-in capital 1,258 632
Accumulated deficit (826) (289)
Treasury stock, Class B common stock at cost, 6,780,500 shares in 2004 — (308)
Treasury stock, common stock, 418,977 shares in 2005 (13) —
Total stockholders' equity 420 36
$6,964 $1,475
See accompanying notes to condensed consolidated financial statements.
98