US Airways 2005 Annual Report Download - page 124
Download and view the complete annual report
Please find page 124 of the 2005 US Airways annual report below. You can navigate through the pages in the report by either clicking on the pages listed below, or by using the keyword search tool below to find specific information within the annual report.-
 1
1 -
2
-
3
-
4
-
5
-
6
-
7
-
8
-
9
-
10
-
11
-
12
-
13
-
14
-
15
-
16
-
17
-
18
-
19
-
20
-
21
-
22
-
23
-
24
-
25
-
26
-
27
-
28
-
29
-
30
-
31
-
32
-
33
-
34
-
35
-
36
-
37
-
38
-
39
-
40
-
41
-
42
-
43
-
44
-
45
-
46
-
47
-
48
-
49
-
50
-
51
-
52
-
53
-
54
-
55
-
56
-
57
-
58
-
59
-
60
-
61
-
62
-
63
-
64
-
65
-
66
-
67
-
68
-
69
-
70
-
71
-
72
-
73
-
74
-
75
-
76
-
77
-
78
-
79
-
80
-
81
-
82
-
83
-
84
-
85
-
86
-
87
-
88
-
89
-
90
-
91
-
92
-
93
-
94
-
95
-
96
-
97
-
98
-
99
-
100
-
101
-
102
-
103
-
104
-
105
-
106
-
107
-
108
-
109
-
110
-
111
-
112
-
113
-
 114
114 -
 115
115 -
 116
116 -
 117
117 -
 118
118 -
 119
119 -
 120
120 -
 121
121 -
 122
122 -
 123
123 -
 124
124 -
 125
125 -
 126
126 -
 127
127 -
 128
128 -
 129
129 -
 130
130 -
 131
131 -
 132
132 -
 133
133 -
 134
134 -
135
-
136
-
137
-
138
-
139
-
140
-
141
-
142
-
143
-
144
-
145
-
146
-
147
-
148
-
149
-
150
-
151
-
152
-
153
-
154
-
155
-
156
-
157
-
158
-
159
-
160
-
161
-
162
-
163
-
164
-
165
-
166
-
167
-
168
-
169
-
170
-
171
-
172
-
173
-
174
-
175
-
176
-
177
-
178
-
179
-
180
-
181
-
182
-
183
-
184
-
185
-
186
-
187
-
188
-
189
-
190
-
191
-
192
-
193
-
194
-
195
-
196
-
197
-
198
-
199
-
200
-
201
-
202
-
203
-
204
-
205
-
206
-
207
-
208
-
209
-
210
-
211
-
212
-
213
-
214
-
215
-
216
-
217
-
218
-
219
-
220
-
221
-
222
-
223
-
224
-
225
-
226
-
227
-
228
-
229
-
230
-
231
-
232
-
233
-
234
-
235
-
236
-
237
-
238
-
239
-
240
-
241
-
242
-
243
-
244
-
245
-
246
-
247
-
248
-
249
-
250
-
251
-
252
-
253
-
254
-
255
-
256
-
257
-
258
-
259
-
260
-
261
-
262
-
263
-
264
-
265
-
266
-
267
-
268
-
269
-
270
-
271
-
272
-
273
-
274
-
275
-
276
-
277
-
278
-
279
-
280
-
281
-
282
-
283
-
284
-
285
-
286
-
287
-
288
-
289
-
290
-
291
-
292
-
293
-
294
-
295
-
296
-
297
-
298
-
299
-
300
-
301
-
302
-
303
-
304
-
305
-
306
-
307
-
308
-
309
-
310
-
311
-
312
-
313
-
314
-
315
-
316
-
317
-
318
-
319
-
320
-
321
-
322
-
323
 |
 |

Table of Contents
US Airways Group, Inc.
Notes to Consolidated Financial Statements — (Continued)
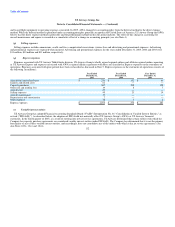
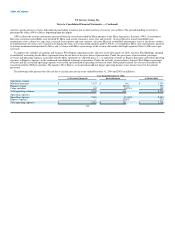
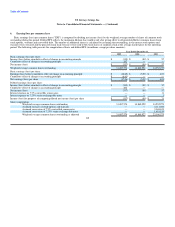
6. Earning/ loss per common share
Basic earnings (loss) per common share ("EPS") is computed by dividing net income (loss) by the weighted average number of shares of common stock
outstanding during the period. Diluted EPS reflects the maximum dilution that would result after giving effect to all potential dilutive common shares from
stock options, warrants and convertible debt. The number of additional shares is calculated by assuming that outstanding, in-the-money stock options and
warrants were exercised and the proceeds from such exercises were used to buy back shares of common stock at the average market price for the reporting
period. The following table presents the computation of basic and diluted EPS (in millions, except per share amounts):
Year Ended December 31,
2005 2004 2003
Basic earnings (loss) per share:
Income (loss) before cumulative effect of change in accounting principle $ (335) $ (89) $ 57
Cumulative effect of change in accounting principle 202 — —
Net income (loss) $ (537) $ (89) $ 57
Weighted average common shares outstanding 31,487,574 14,860,922 14,252,279
Basic earnings (loss) per share:
Earnings (loss) before cumulative effect of change in accounting principle $ (10.65) $ (5.99) $ 4.03
Cumulative effect of change in accounting principle $ (6.41) — —
Net earnings (loss) per share $ (17.06) $ (5.99) $ 4.03
Diluted earnings (loss) per share:
Income (loss) before cumulative effect of change in accounting principle $ (335) $ (89) $ 57
Cumulative effect of change in accounting principle 202 — —
Net income (loss) (537) (89) 57
Interest expense on 7.5% convertible senior notes — — 11
Interest expense on 7.25% senior exchangeable notes — — 3
Income (loss) for purposes of computing diluted net income (loss) per share $ (537) $ (89) $ 71
Share computation:
Weighted average common shares outstanding 31,487,574 14,860,922 14,252,279
Assumed exercise of stock options and warrants — — 4,111,028
Assumed conversion of 7.5% convertible senior notes — — 3,365,109
Assumed conversion of 7.25% senior exchangeable notes — — 1,418,159
Weighted average common shares outstanding as adjusted 31,487,574 14,860,922 23,146,575
118