US Airways 2005 Annual Report Download - page 158
Download and view the complete annual report
Please find page 158 of the 2005 US Airways annual report below. You can navigate through the pages in the report by either clicking on the pages listed below, or by using the keyword search tool below to find specific information within the annual report.-
 1
1 -
2
-
3
-
4
-
5
-
6
-
7
-
8
-
9
-
10
-
11
-
12
-
13
-
14
-
15
-
16
-
17
-
18
-
19
-
20
-
21
-
22
-
23
-
24
-
25
-
26
-
27
-
28
-
29
-
30
-
31
-
32
-
33
-
34
-
35
-
36
-
37
-
38
-
39
-
40
-
41
-
42
-
43
-
44
-
45
-
46
-
47
-
48
-
49
-
50
-
51
-
52
-
53
-
54
-
55
-
56
-
57
-
58
-
59
-
60
-
61
-
62
-
63
-
64
-
65
-
66
-
67
-
68
-
69
-
70
-
71
-
72
-
73
-
74
-
75
-
76
-
77
-
78
-
79
-
80
-
81
-
82
-
83
-
84
-
85
-
86
-
87
-
88
-
89
-
90
-
91
-
92
-
93
-
94
-
95
-
96
-
97
-
98
-
99
-
100
-
101
-
102
-
103
-
104
-
105
-
106
-
107
-
108
-
109
-
110
-
111
-
112
-
113
-
114
-
115
-
116
-
117
-
118
-
119
-
120
-
121
-
122
-
123
-
124
-
125
-
126
-
127
-
128
-
129
-
130
-
131
-
132
-
133
-
134
-
135
-
136
-
137
-
138
-
139
-
140
-
141
-
142
-
143
-
144
-
145
-
146
-
147
-
 148
148 -
 149
149 -
 150
150 -
 151
151 -
 152
152 -
 153
153 -
 154
154 -
 155
155 -
 156
156 -
 157
157 -
 158
158 -
 159
159 -
 160
160 -
 161
161 -
 162
162 -
 163
163 -
 164
164 -
 165
165 -
 166
166 -
 167
167 -
 168
168 -
169
-
170
-
171
-
172
-
173
-
174
-
175
-
176
-
177
-
178
-
179
-
180
-
181
-
182
-
183
-
184
-
185
-
186
-
187
-
188
-
189
-
190
-
191
-
192
-
193
-
194
-
195
-
196
-
197
-
198
-
199
-
200
-
201
-
202
-
203
-
204
-
205
-
206
-
207
-
208
-
209
-
210
-
211
-
212
-
213
-
214
-
215
-
216
-
217
-
218
-
219
-
220
-
221
-
222
-
223
-
224
-
225
-
226
-
227
-
228
-
229
-
230
-
231
-
232
-
233
-
234
-
235
-
236
-
237
-
238
-
239
-
240
-
241
-
242
-
243
-
244
-
245
-
246
-
247
-
248
-
249
-
250
-
251
-
252
-
253
-
254
-
255
-
256
-
257
-
258
-
259
-
260
-
261
-
262
-
263
-
264
-
265
-
266
-
267
-
268
-
269
-
270
-
271
-
272
-
273
-
274
-
275
-
276
-
277
-
278
-
279
-
280
-
281
-
282
-
283
-
284
-
285
-
286
-
287
-
288
-
289
-
290
-
291
-
292
-
293
-
294
-
295
-
296
-
297
-
298
-
299
-
300
-
301
-
302
-
303
-
304
-
305
-
306
-
307
-
308
-
309
-
310
-
311
-
312
-
313
-
314
-
315
-
316
-
317
-
318
-
319
-
320
-
321
-
322
-
323
 |
 |

Table of Contents
US Airways Group, Inc.
Notes to Consolidated Financial Statements — (Continued)
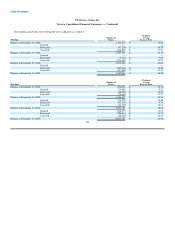
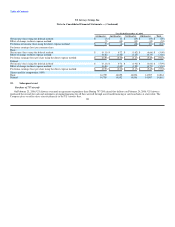
processing agreements. The unaudited pro forma information presented below is not necessarily indicative of the results of operations that would have
occurred had the purchase been made at the beginning of the periods presented or of future results of the combined operations (in millions, except share and
per share amounts).
Year Ended Year Ended
December 31, December 31,
2005 2004
Operating revenues $ 10,440 $ 9,456
Operating expenses 10,799 9,858
Operating loss (359) (402)
Net loss $ (891) $ (652)
Basic and fully diluted loss per share $ (13.89) $ (10.93)
Basic and diluted shares (in thousands) 64,159 59,654
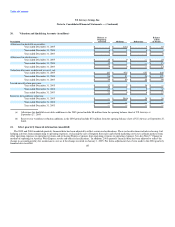
17. Operating segments and related disclosures
US Airways Group is managed as a single business unit that provides air transportation for passengers and cargo. This allows it to benefit from an
integrated revenue pricing and route network that includes US Airways, AWA, Piedmont, PSA and third-party carriers that fly under capacity purchase
agreements as part of the Company's Express operations. The flight equipment of all these carriers is combined to form one fleet that is deployed through a
single route scheduling system. When making resource allocation decisions, the chief operating decision maker evaluates flight profitability data, which
considers aircraft type and route economics, but gives no weight to the financial impact of the resource allocation decision on an individual carrier basis. The
objective in making resource allocation decisions is to maximize consolidated financial results, not the individual results of US Airways, AWA, Piedmont and
PSA.
Information concerning operating revenues in principal geographic areas is as follows (in millions):
Year Ended Year Ended Year Ended
December 31, December 31, December 31,
2005 2004 2003
United States $ 4,575 $ 2,572 $ 2,431
Foreign 502 176 141
Total $ 5,077 $ 2,748 $ 2,572
18. Stockholder's Equity
(a) Common Stock
Holders of common stock are entitled to one vote per share on all matters submitted to a vote of common shareholders, except that voting rights of
non-U.S. citizens are limited to the extent that the shares of common stock held by such non-U.S. persons would otherwise be entitled to more than 24.9% of
the aggregate votes of all outstanding equity securities of US Airways Group. Holders of common stock have no right to cumulate their votes. Holders of
common stock participate equally as to any dividends or distributions on the common stock.
(b) Warrants
As compensation for various elements of AWA's financial restructuring completed in January 2002, America West Holdings issued a warrant to
purchase 18.8 million shares of its Class B common stock to 152