US Airways 2005 Annual Report Download - page 306
Download and view the complete annual report
Please find page 306 of the 2005 US Airways annual report below. You can navigate through the pages in the report by either clicking on the pages listed below, or by using the keyword search tool below to find specific information within the annual report.-
 1
1 -
2
-
3
-
4
-
5
-
6
-
7
-
8
-
9
-
10
-
11
-
12
-
13
-
14
-
15
-
16
-
17
-
18
-
19
-
20
-
21
-
22
-
23
-
24
-
25
-
26
-
27
-
28
-
29
-
30
-
31
-
32
-
33
-
34
-
35
-
36
-
37
-
38
-
39
-
40
-
41
-
42
-
43
-
44
-
45
-
46
-
47
-
48
-
49
-
50
-
51
-
52
-
53
-
54
-
55
-
56
-
57
-
58
-
59
-
60
-
61
-
62
-
63
-
64
-
65
-
66
-
67
-
68
-
69
-
70
-
71
-
72
-
73
-
74
-
75
-
76
-
77
-
78
-
79
-
80
-
81
-
82
-
83
-
84
-
85
-
86
-
87
-
88
-
89
-
90
-
91
-
92
-
93
-
94
-
95
-
96
-
97
-
98
-
99
-
100
-
101
-
102
-
103
-
104
-
105
-
106
-
107
-
108
-
109
-
110
-
111
-
112
-
113
-
114
-
115
-
116
-
117
-
118
-
119
-
120
-
121
-
122
-
123
-
124
-
125
-
126
-
127
-
128
-
129
-
130
-
131
-
132
-
133
-
134
-
135
-
136
-
137
-
138
-
139
-
140
-
141
-
142
-
143
-
144
-
145
-
146
-
147
-
148
-
149
-
150
-
151
-
152
-
153
-
154
-
155
-
156
-
157
-
158
-
159
-
160
-
161
-
162
-
163
-
164
-
165
-
166
-
167
-
168
-
169
-
170
-
171
-
172
-
173
-
174
-
175
-
176
-
177
-
178
-
179
-
180
-
181
-
182
-
183
-
184
-
185
-
186
-
187
-
188
-
189
-
190
-
191
-
192
-
193
-
194
-
195
-
196
-
197
-
198
-
199
-
200
-
201
-
202
-
203
-
204
-
205
-
206
-
207
-
208
-
209
-
210
-
211
-
212
-
213
-
214
-
215
-
216
-
217
-
218
-
219
-
220
-
221
-
222
-
223
-
224
-
225
-
226
-
227
-
228
-
229
-
230
-
231
-
232
-
233
-
234
-
235
-
236
-
237
-
238
-
239
-
240
-
241
-
242
-
243
-
244
-
245
-
246
-
247
-
248
-
249
-
250
-
251
-
252
-
253
-
254
-
255
-
256
-
257
-
258
-
259
-
260
-
261
-
262
-
263
-
264
-
265
-
266
-
267
-
268
-
269
-
270
-
271
-
272
-
273
-
274
-
275
-
276
-
277
-
278
-
279
-
280
-
281
-
282
-
283
-
284
-
285
-
286
-
287
-
288
-
289
-
290
-
291
-
292
-
293
-
294
-
295
-
 296
296 -
 297
297 -
 298
298 -
 299
299 -
 300
300 -
 301
301 -
 302
302 -
 303
303 -
 304
304 -
 305
305 -
 306
306 -
 307
307 -
 308
308 -
 309
309 -
 310
310 -
 311
311 -
 312
312 -
 313
313 -
 314
314 -
 315
315 -
 316
316 -
317
-
318
-
319
-
320
-
321
-
322
-
323
 |
 |

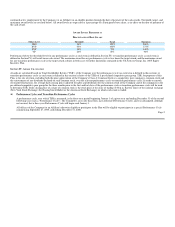
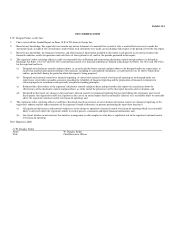
continued active employment by the Company (or an Affiliate) in an eligible position through the date of payment of the cash awards. Threshold, target, and
maximum award levels are set forth below. All award levels are expressed as a percentage of a Participant's base salary, as in effect on the date of payment of
the cash award.
AWARD LEVELS EXPRESSED AS
PERCENTAGES OF BASE SALARY
Officer Level Threshold Target Maximum
CEO 54% 125% 200%
EVP 43% 100% 175%
SVP 30% 70% 140%
VP 20% 45% 90%
Performance below the threshold level for any performance cycle (as such term is defined in Section IV) or transition performance cycle (as such term is
defined in Section IV) will result in no cash award. The maximum award for any performance cycle is two times the target award, and the maximum award
for any transition performance cycle is the target award, subject in both cases to further limitations contained in the US Airways Group, Inc. 2005 Equity
Incentive Plan.
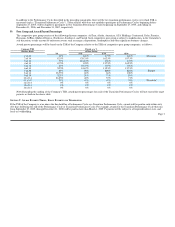
SECTION IV. AWARD CALCULATION
Awards are calculated based on Total Stockholder Return ("TSR") of the Company over the performance cycle (as such term is defined in this section) or
transition performance cycle (as such term is defined in this section) relative to the TSRs of a pre-defined competitive peer group. TSR, for purposes of this
Plan, is the rate of return, including both the price appreciation of the Company's Class A Common Stock or a competitive peer company's common stock and
the reinvestment of any dividends declared on such common stock, over the relevant performance cycle or transition performance cycle. In order to smooth
out market fluctuations, the average daily closing price (adjusted for splits and dividends) for the common stock of the Company and of the companies in the
pre-defined competitive peer group for the three months prior to the first and last days of the performance cycle or transition performance cycle will be used
to determine TSR. Daily closing price of a share of common stock is the stock price at the close of trading (4:00 p.m. Eastern Time) of the national exchange
(New York Stock Exchange, the Nasdaq Stock Market or the American Stock Exchange) on which such stock is traded.
A) Performance Cycles and Transition Performance Cycles
A performance cycle, over which TSR is measured, is the three-year period beginning January 1 of a given year and ending December 31 of the second
following year (each a "Performance Cycle"). The Committee, in its sole discretion, may authorize Performance Cycles, and it is anticipated, although
not assured, that a three-year Performance Cycle will begin each January 1.
All officers of the Company (or an Affiliate) otherwise eligible to participate in the Plan will be eligible to participate in a special Performance Cycle
commencing September 27, 2005, and ending December 31, 2008. Page 2