US Airways 2005 Annual Report Download - page 65
Download and view the complete annual report
Please find page 65 of the 2005 US Airways annual report below. You can navigate through the pages in the report by either clicking on the pages listed below, or by using the keyword search tool below to find specific information within the annual report.-
 1
1 -
2
-
3
-
4
-
5
-
6
-
7
-
8
-
9
-
10
-
11
-
12
-
13
-
14
-
15
-
16
-
17
-
18
-
19
-
20
-
21
-
22
-
23
-
24
-
25
-
26
-
27
-
28
-
29
-
30
-
31
-
32
-
33
-
34
-
35
-
36
-
37
-
38
-
39
-
40
-
41
-
42
-
43
-
44
-
45
-
46
-
47
-
48
-
49
-
50
-
51
-
52
-
53
-
54
-
 55
55 -
 56
56 -
 57
57 -
 58
58 -
 59
59 -
 60
60 -
 61
61 -
 62
62 -
 63
63 -
 64
64 -
 65
65 -
 66
66 -
 67
67 -
 68
68 -
 69
69 -
 70
70 -
 71
71 -
 72
72 -
 73
73 -
 74
74 -
 75
75 -
76
-
77
-
78
-
79
-
80
-
81
-
82
-
83
-
84
-
85
-
86
-
87
-
88
-
89
-
90
-
91
-
92
-
93
-
94
-
95
-
96
-
97
-
98
-
99
-
100
-
101
-
102
-
103
-
104
-
105
-
106
-
107
-
108
-
109
-
110
-
111
-
112
-
113
-
114
-
115
-
116
-
117
-
118
-
119
-
120
-
121
-
122
-
123
-
124
-
125
-
126
-
127
-
128
-
129
-
130
-
131
-
132
-
133
-
134
-
135
-
136
-
137
-
138
-
139
-
140
-
141
-
142
-
143
-
144
-
145
-
146
-
147
-
148
-
149
-
150
-
151
-
152
-
153
-
154
-
155
-
156
-
157
-
158
-
159
-
160
-
161
-
162
-
163
-
164
-
165
-
166
-
167
-
168
-
169
-
170
-
171
-
172
-
173
-
174
-
175
-
176
-
177
-
178
-
179
-
180
-
181
-
182
-
183
-
184
-
185
-
186
-
187
-
188
-
189
-
190
-
191
-
192
-
193
-
194
-
195
-
196
-
197
-
198
-
199
-
200
-
201
-
202
-
203
-
204
-
205
-
206
-
207
-
208
-
209
-
210
-
211
-
212
-
213
-
214
-
215
-
216
-
217
-
218
-
219
-
220
-
221
-
222
-
223
-
224
-
225
-
226
-
227
-
228
-
229
-
230
-
231
-
232
-
233
-
234
-
235
-
236
-
237
-
238
-
239
-
240
-
241
-
242
-
243
-
244
-
245
-
246
-
247
-
248
-
249
-
250
-
251
-
252
-
253
-
254
-
255
-
256
-
257
-
258
-
259
-
260
-
261
-
262
-
263
-
264
-
265
-
266
-
267
-
268
-
269
-
270
-
271
-
272
-
273
-
274
-
275
-
276
-
277
-
278
-
279
-
280
-
281
-
282
-
283
-
284
-
285
-
286
-
287
-
288
-
289
-
290
-
291
-
292
-
293
-
294
-
295
-
296
-
297
-
298
-
299
-
300
-
301
-
302
-
303
-
304
-
305
-
306
-
307
-
308
-
309
-
310
-
311
-
312
-
313
-
314
-
315
-
316
-
317
-
318
-
319
-
320
-
321
-
322
-
323
 |
 |
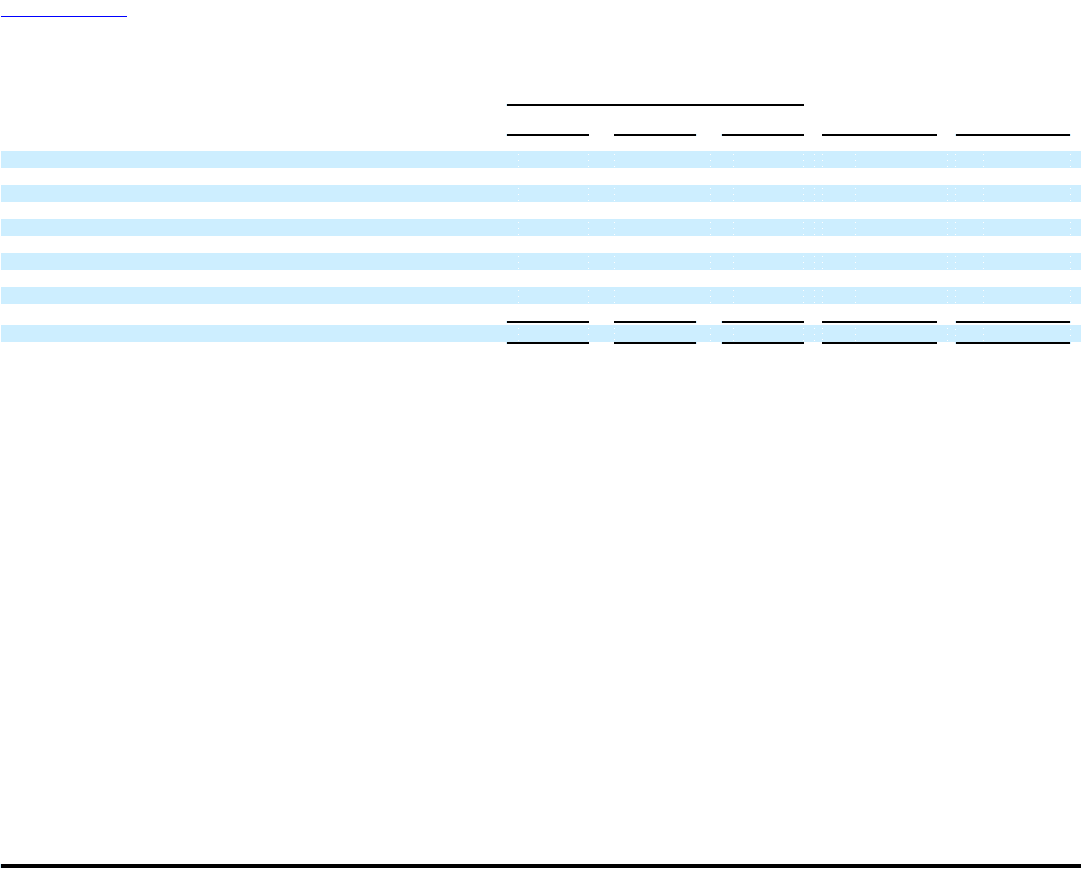
Table of Contents
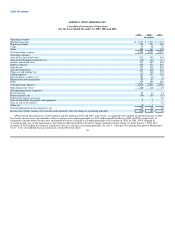
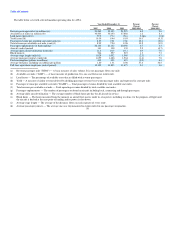
The table below sets forth the major components of mainline CASM for AWA for the applicable years:
Year Ended December 31, Percent Percent
Change Change
2005 2004 2003 2005-2004 2004-2003
(In cents)
Aircraft fuel and related taxes 2.66 1.95 1.45 36.0 35.0
Gains on fuel hedging instruments, net (0.25) (0.08) (0.04) — —
Salaries and related costs 2.30 2.17 2.36 5.8 (7.9)
Aircraft rent 1.07 1.01 1.07 6.3 (5.4)
Aircraft maintenance 0.85 0.68 0.80 24.5 (14.8)
Other rent and landing fees 0.58 0.56 0.55 3.8 0.4
Selling expenses 0.53 0.51 0.56 4.2 (9.2)
Depreciation and amortization 0.17 0.18 0.24 (3.6) (24.8)
Special charges (credits), net 0.35 (0.05) 0.06 — —
Other 1.02 0.99 1.02 2.3 (2.5)
9.28 7.92 8.07 17.0 (1.7)
2005 Compared With 2004
Total operating revenues for 2005 were $3.25 billion, an increase of $507 million from 2004. Passenger revenues were $2.52 billion in 2005 compared to
$2.20 billion in 2004. RPM's increased 4.0% as mainline capacity, as measured by ASM's, increased 1.2%, resulting in a 2.1 point increase in load factor to
79.5%. This increase in load factor was achieved with higher passenger yield, which increased 10.1% to 10.39 cents. As a result, mainline RASM during 2005
increased 13.1% to 8.27 cents from 7.31 cents in 2004, despite a 2.3% decrease in average stage length.
Express passenger revenues were $512 million for 2005, an increase of $159 million from 2004 due to increased flying by Mesa under its alliance
agreement with AWA.
Cargo revenues for 2005 increased $5 million, or 17.9%, to $33 million due to higher mail volumes. Other revenues increased 15.3% from $163 million in
2004 to $188 million in 2005 due principally to net revenues associated with the sale of tour packages by the America West Vacations division and an
increase in ticket change and service fees.
Total operating expenses were $3.37 billion in 2005, an increase of $611 million or 22.1% compared to 2004. Mainline operating expenses were
$2.83 billion in 2005, an increase of $440 million from 2004, while ASMs increased 1.2%. Mainline CASM increased 17.0% to 9.28 cents in 2005 from 7.92
cents in 2004. The 2005 period includes $106 million of net special charges, which comprises 0.35 cents of mainline CASM, as compared to $16 million of
net special credits in 2004. The increase in CASM during 2005 was due principally to a 37.9% increase in the average fuel price per gallon, offset by the
$75 million net gain associated with the fuel hedging transactions discussed above.
Significant changes in the components of operating expense per ASM are explained as follows:
• Aircraft fuel and related tax expense per ASM increased 36.0% due primarily to a 37.4% increase in the average price per gallon of fuel to $1.80 in
2005 from $1.31 in 2004.
• Salaries and related costs per ASM increased 5.8% primarily due to a $23 million increase in benefit related expenses, including $13 million in defined
contribution plan payments that our pilots became eligible for beginning on January 1, 2005, a $5 million increase related to self-funded disability
requirements and higher medical insurance costs of $4 million. A $9 million accrual for employee performance bonuses also contributed to the increase.
59