US Airways 2005 Annual Report Download - page 67
Download and view the complete annual report
Please find page 67 of the 2005 US Airways annual report below. You can navigate through the pages in the report by either clicking on the pages listed below, or by using the keyword search tool below to find specific information within the annual report.-
 1
1 -
2
-
3
-
4
-
5
-
6
-
7
-
8
-
9
-
10
-
11
-
12
-
13
-
14
-
15
-
16
-
17
-
18
-
19
-
20
-
21
-
22
-
23
-
24
-
25
-
26
-
27
-
28
-
29
-
30
-
31
-
32
-
33
-
34
-
35
-
36
-
37
-
38
-
39
-
40
-
41
-
42
-
43
-
44
-
45
-
46
-
47
-
48
-
49
-
50
-
51
-
52
-
53
-
54
-
55
-
56
-
 57
57 -
 58
58 -
 59
59 -
 60
60 -
 61
61 -
 62
62 -
 63
63 -
 64
64 -
 65
65 -
 66
66 -
 67
67 -
 68
68 -
 69
69 -
 70
70 -
 71
71 -
 72
72 -
 73
73 -
 74
74 -
 75
75 -
 76
76 -
 77
77 -
78
-
79
-
80
-
81
-
82
-
83
-
84
-
85
-
86
-
87
-
88
-
89
-
90
-
91
-
92
-
93
-
94
-
95
-
96
-
97
-
98
-
99
-
100
-
101
-
102
-
103
-
104
-
105
-
106
-
107
-
108
-
109
-
110
-
111
-
112
-
113
-
114
-
115
-
116
-
117
-
118
-
119
-
120
-
121
-
122
-
123
-
124
-
125
-
126
-
127
-
128
-
129
-
130
-
131
-
132
-
133
-
134
-
135
-
136
-
137
-
138
-
139
-
140
-
141
-
142
-
143
-
144
-
145
-
146
-
147
-
148
-
149
-
150
-
151
-
152
-
153
-
154
-
155
-
156
-
157
-
158
-
159
-
160
-
161
-
162
-
163
-
164
-
165
-
166
-
167
-
168
-
169
-
170
-
171
-
172
-
173
-
174
-
175
-
176
-
177
-
178
-
179
-
180
-
181
-
182
-
183
-
184
-
185
-
186
-
187
-
188
-
189
-
190
-
191
-
192
-
193
-
194
-
195
-
196
-
197
-
198
-
199
-
200
-
201
-
202
-
203
-
204
-
205
-
206
-
207
-
208
-
209
-
210
-
211
-
212
-
213
-
214
-
215
-
216
-
217
-
218
-
219
-
220
-
221
-
222
-
223
-
224
-
225
-
226
-
227
-
228
-
229
-
230
-
231
-
232
-
233
-
234
-
235
-
236
-
237
-
238
-
239
-
240
-
241
-
242
-
243
-
244
-
245
-
246
-
247
-
248
-
249
-
250
-
251
-
252
-
253
-
254
-
255
-
256
-
257
-
258
-
259
-
260
-
261
-
262
-
263
-
264
-
265
-
266
-
267
-
268
-
269
-
270
-
271
-
272
-
273
-
274
-
275
-
276
-
277
-
278
-
279
-
280
-
281
-
282
-
283
-
284
-
285
-
286
-
287
-
288
-
289
-
290
-
291
-
292
-
293
-
294
-
295
-
296
-
297
-
298
-
299
-
300
-
301
-
302
-
303
-
304
-
305
-
306
-
307
-
308
-
309
-
310
-
311
-
312
-
313
-
314
-
315
-
316
-
317
-
318
-
319
-
320
-
321
-
322
-
323
 |
 |

Table of Contents
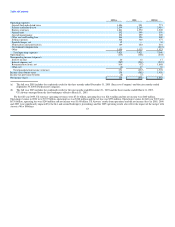
during 2004 decreased 3.8% to 7.31 cents from 7.60 cents in 2003, despite a 4.7% increase in average stage length, while yields decreased 5.1% to 9.44 cents.
Express passenger revenues were $353 million for 2004, an increase of $85 million from 2003 due to increased flying by Mesa under its alliance
agreement with AWA.
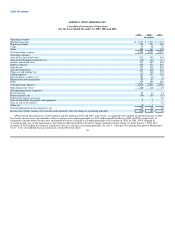
Total operating expenses were $2.76 billion in 2004, an increase of $229 million or 9.0% compared to 2003. Mainline operating expenses were
$2.39 billion in 2004, an increase of $142 million from 2003, while ASMs increased 8.1%. Mainline CASM decreased 1.7% to 7.92 cents in 2004 from 8.07
cents in 2003, despite a 36.5% increase in the average fuel price per gallon. The 2004 period includes $16 million of net special credits, which reduced 2004
mainline CASM by 0.05 cents, as compared to $14 million of net special charges in 2003, which increased mainline CASM by 0.06 cents. Significant changes
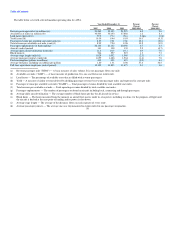
in the components of operating expense per ASM are explained as follows:
• Aircraft fuel and related tax expense per ASM increased 35.0% due primarily to a 36.5% increase in the average price per gallon of fuel to $1.31 in
2004 from $0.96 in 2003.
• Salaries and related costs per ASM decreased 7.9% due to increased productivity. ASMs increased 8.1% in 2004, while average full-time equivalent
employees decreased 2.2% year-over year. This increase in productivity was offset in part by a $27 million increase in pilot payroll expense, principally
as a result of the new labor agreement with ALPA that was effective December 30, 2003.
• Aircraft rent expense per ASM decreased 5.4% due to the 7.9% increase in aircraft utilization.
• Aircraft maintenance materials and repair expense per ASM decreased 14.8% due to decreases in capitalized maintenance amortization expense
($23 million) and aircraft maintenance expense ($4 million). The decrease in capitalized maintenance amortization expense was driven by changes in
the estimated useful life of certain engines, effective January 1, 2004, as a result of changes in aircraft utilization ($9 million) and certain aircraft engine
overhaul costs, effective April 1, 2003, driven by a new maintenance agreement that guarantees minimum cycles on engine overhauls ($2 million).
These decreases were partially offset by increases in airframe maintenance ($6 million) and engine overhaul ($4 million) expenses.
• Other rents and landing fees expense per ASM remained flat year over year as increases in airport rents ($7 million) and landing fees ($6 million) were
offset by the 8.1% increase in ASMs.
• Selling expenses per ASM decreased 9.2% due to reductions in various travel agency incentive programs and override commissions ($9 million) and
decreases in advertising expenses ($1 million), which were offset in part by higher credit card expenses ($4 million), and reservation system booking
fees ($4 million).
• Depreciation and amortization expense per ASM decreased 24.8% due to lower computer hardware and software amortization ($6 million) as a result of
AWA's cash conservation program, which reduced capital expenditures, and lower amortization on aircraft leasehold improvements ($2 million). The
change in the estimated useful life resulting from changes in aircraft utilization discussed above contributed to the decrease in depreciation for
improvements on AWA's owned aircraft ($3 million) and rotable and repairable spare parts ($2 million).
• Other operating expenses per ASM decreased 2.5% in 2004. Decreases in catering costs ($6 million), bad debt expense ($3 million) and traffic liability
insurance ($2 million) were offset by increases in passenger traffic related expenses ($4 million), legal fees ($4 million), airport guard services
($2 million) and ground handling expenses ($2 million). The 2004 period included a $6 million charge resulting from the settlement of pending
litigation and a $5 million loss on the sale and leaseback of two new aircraft. A $4 million gain resulting from the settlement of a claim in bankruptcy
for amounts earned under an executory contract, a $2 million gain resulting from the settlement of a lawsuit related to certain computer hardware and
software that had previously been written off, a $2 million reduction in bad debt expense due to a recovery of a previously reserved
61