US Airways 2005 Annual Report Download - page 171
Download and view the complete annual report
Please find page 171 of the 2005 US Airways annual report below. You can navigate through the pages in the report by either clicking on the pages listed below, or by using the keyword search tool below to find specific information within the annual report.-
 1
1 -
2
-
3
-
4
-
5
-
6
-
7
-
8
-
9
-
10
-
11
-
12
-
13
-
14
-
15
-
16
-
17
-
18
-
19
-
20
-
21
-
22
-
23
-
24
-
25
-
26
-
27
-
28
-
29
-
30
-
31
-
32
-
33
-
34
-
35
-
36
-
37
-
38
-
39
-
40
-
41
-
42
-
43
-
44
-
45
-
46
-
47
-
48
-
49
-
50
-
51
-
52
-
53
-
54
-
55
-
56
-
57
-
58
-
59
-
60
-
61
-
62
-
63
-
64
-
65
-
66
-
67
-
68
-
69
-
70
-
71
-
72
-
73
-
74
-
75
-
76
-
77
-
78
-
79
-
80
-
81
-
82
-
83
-
84
-
85
-
86
-
87
-
88
-
89
-
90
-
91
-
92
-
93
-
94
-
95
-
96
-
97
-
98
-
99
-
100
-
101
-
102
-
103
-
104
-
105
-
106
-
107
-
108
-
109
-
110
-
111
-
112
-
113
-
114
-
115
-
116
-
117
-
118
-
119
-
120
-
121
-
122
-
123
-
124
-
125
-
126
-
127
-
128
-
129
-
130
-
131
-
132
-
133
-
134
-
135
-
136
-
137
-
138
-
139
-
140
-
141
-
142
-
143
-
144
-
145
-
146
-
147
-
148
-
149
-
150
-
151
-
152
-
153
-
154
-
155
-
156
-
157
-
158
-
159
-
160
-
 161
161 -
 162
162 -
 163
163 -
 164
164 -
 165
165 -
 166
166 -
 167
167 -
 168
168 -
 169
169 -
 170
170 -
 171
171 -
 172
172 -
 173
173 -
 174
174 -
 175
175 -
 176
176 -
 177
177 -
 178
178 -
 179
179 -
 180
180 -
 181
181 -
182
-
183
-
184
-
185
-
186
-
187
-
188
-
189
-
190
-
191
-
192
-
193
-
194
-
195
-
196
-
197
-
198
-
199
-
200
-
201
-
202
-
203
-
204
-
205
-
206
-
207
-
208
-
209
-
210
-
211
-
212
-
213
-
214
-
215
-
216
-
217
-
218
-
219
-
220
-
221
-
222
-
223
-
224
-
225
-
226
-
227
-
228
-
229
-
230
-
231
-
232
-
233
-
234
-
235
-
236
-
237
-
238
-
239
-
240
-
241
-
242
-
243
-
244
-
245
-
246
-
247
-
248
-
249
-
250
-
251
-
252
-
253
-
254
-
255
-
256
-
257
-
258
-
259
-
260
-
261
-
262
-
263
-
264
-
265
-
266
-
267
-
268
-
269
-
270
-
271
-
272
-
273
-
274
-
275
-
276
-
277
-
278
-
279
-
280
-
281
-
282
-
283
-
284
-
285
-
286
-
287
-
288
-
289
-
290
-
291
-
292
-
293
-
294
-
295
-
296
-
297
-
298
-
299
-
300
-
301
-
302
-
303
-
304
-
305
-
306
-
307
-
308
-
309
-
310
-
311
-
312
-
313
-
314
-
315
-
316
-
317
-
318
-
319
-
320
-
321
-
322
-
323
 |
 |

Table of Contents
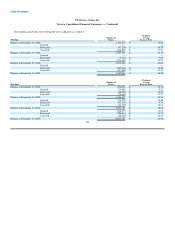
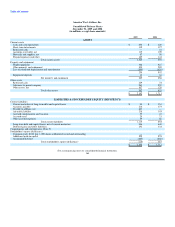
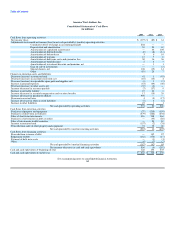
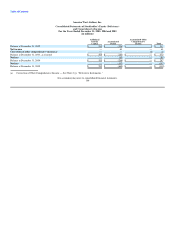
America West Airlines, Inc.
Consolidated Statements of Cash Flows
(in millions)
2005 2004 2003
Cash flows from operating activities:
Net income (loss) $ (397) $ (85) $ 61
Adjustments to reconcile net income (loss) to net cash provided by (used in) operating activities:
Cumulative effect of change in accounting principle 202 — —
Depreciation and amortization 53 54 67
Amortization of capitalized maintenance — 86 105
Amortization of deferred credits (8) (8) (11)
Amortization of deferred rent 5 6 10
Amortization of warrants 12 7 8
Amortization of debt issue costs and guarantee fees 30 36 36
Amortization of bond discount 5 4 3
Amortization of investment discount and premium, net — 1 1
Gain on sale of investments — — (3)
Special charges, net 106 (15) 14
Other (18) 28 7
Changes in operating assets and liabilities:
Decrease (increase) in restricted cash 41 1 (43)
Decrease (increase) in accounts receivable, net (10) (13) 4
Decrease (increase) in expendable spare parts and supplies, net (3) 1 (2)
Increase in prepaid expenses (53) (49) (46)
Decrease (increase) in other assets, net (37) (3) —
Increase (decrease) in accounts payable (7) (37) 9
Increase in air traffic liability 23 20 4
Increase (decrease) in accrued compensation and vacation benefits 12 (18) 20
Increase (decrease) in payable to affiliate 998 — —
Decrease in accrued taxes 4 (3) (17)
Increase (decrease) in other accrued liabilities (7) 6 (2)
Increase in other liabilities 23 1 1
Net cash provided by operating activities 974 20 226
Cash flows from investing activities:
Purchases of property and equipment (37) (219) (154)
Purchases of short-term investments (579) (488) (634)
Sales of short-term investments 416 708 364
Purchases of investments in debt securities — (35) (80)
Sales of investments in debt securities — 20 10
Increase in restricted cash (157) (2) (24)
Proceeds from sales of other property and equipment 74 32 26
Net cash provided by (used in) investing activities (283) 16 (492)
Cash flows from financing activities
Proceeds from issuance of debt — 142 87
Repayment of debt (183) (176) (17)
Payment of debt issue costs — (1) (3)
Other (4) (7) (2)
Net cash provided by (used in) financing activities (187) (42) 65
Net increase (decrease) in cash and cash equivalents 504 (6) (201)
Cash and cash equivalents at beginning of year 128 134 335
Cash and cash equivalents at end of year $ 632 $ 128 $ 134
See accompanying notes to consolidated financial statements.
165