US Airways 2005 Annual Report Download - page 72
Download and view the complete annual report
Please find page 72 of the 2005 US Airways annual report below. You can navigate through the pages in the report by either clicking on the pages listed below, or by using the keyword search tool below to find specific information within the annual report.-
 1
1 -
2
-
3
-
4
-
5
-
6
-
7
-
8
-
9
-
10
-
11
-
12
-
13
-
14
-
15
-
16
-
17
-
18
-
19
-
20
-
21
-
22
-
23
-
24
-
25
-
26
-
27
-
28
-
29
-
30
-
31
-
32
-
33
-
34
-
35
-
36
-
37
-
38
-
39
-
40
-
41
-
42
-
43
-
44
-
45
-
46
-
47
-
48
-
49
-
50
-
51
-
52
-
53
-
54
-
55
-
56
-
57
-
58
-
59
-
60
-
61
-
 62
62 -
 63
63 -
 64
64 -
 65
65 -
 66
66 -
 67
67 -
 68
68 -
 69
69 -
 70
70 -
 71
71 -
 72
72 -
 73
73 -
 74
74 -
 75
75 -
 76
76 -
 77
77 -
 78
78 -
 79
79 -
 80
80 -
 81
81 -
 82
82 -
83
-
84
-
85
-
86
-
87
-
88
-
89
-
90
-
91
-
92
-
93
-
94
-
95
-
96
-
97
-
98
-
99
-
100
-
101
-
102
-
103
-
104
-
105
-
106
-
107
-
108
-
109
-
110
-
111
-
112
-
113
-
114
-
115
-
116
-
117
-
118
-
119
-
120
-
121
-
122
-
123
-
124
-
125
-
126
-
127
-
128
-
129
-
130
-
131
-
132
-
133
-
134
-
135
-
136
-
137
-
138
-
139
-
140
-
141
-
142
-
143
-
144
-
145
-
146
-
147
-
148
-
149
-
150
-
151
-
152
-
153
-
154
-
155
-
156
-
157
-
158
-
159
-
160
-
161
-
162
-
163
-
164
-
165
-
166
-
167
-
168
-
169
-
170
-
171
-
172
-
173
-
174
-
175
-
176
-
177
-
178
-
179
-
180
-
181
-
182
-
183
-
184
-
185
-
186
-
187
-
188
-
189
-
190
-
191
-
192
-
193
-
194
-
195
-
196
-
197
-
198
-
199
-
200
-
201
-
202
-
203
-
204
-
205
-
206
-
207
-
208
-
209
-
210
-
211
-
212
-
213
-
214
-
215
-
216
-
217
-
218
-
219
-
220
-
221
-
222
-
223
-
224
-
225
-
226
-
227
-
228
-
229
-
230
-
231
-
232
-
233
-
234
-
235
-
236
-
237
-
238
-
239
-
240
-
241
-
242
-
243
-
244
-
245
-
246
-
247
-
248
-
249
-
250
-
251
-
252
-
253
-
254
-
255
-
256
-
257
-
258
-
259
-
260
-
261
-
262
-
263
-
264
-
265
-
266
-
267
-
268
-
269
-
270
-
271
-
272
-
273
-
274
-
275
-
276
-
277
-
278
-
279
-
280
-
281
-
282
-
283
-
284
-
285
-
286
-
287
-
288
-
289
-
290
-
291
-
292
-
293
-
294
-
295
-
296
-
297
-
298
-
299
-
300
-
301
-
302
-
303
-
304
-
305
-
306
-
307
-
308
-
309
-
310
-
311
-
312
-
313
-
314
-
315
-
316
-
317
-
318
-
319
-
320
-
321
-
322
-
323
 |
 |

Table of Contents
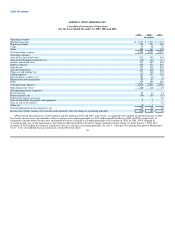
14.8% increase in purchased ASMs, and increased flying by MidAtlantic in 2005 and as a result of higher fuel prices that are paid by US Airways for
US Airways Express operations.
US Airways had net nonoperating income of $371 million in 2005 compared to nonoperating expense of $237 million in 2004. The change in
nonoperating income (expense) is primarily a result of the reorganization items representing amounts incurred as a direct result of the Chapter 11 proceedings.
See the description below for additional information on the components of reorganization items. Interest income increased $14 million in 2005 as compared to
2004 due to higher cash balances, principally in the fourth quarter of 2005, and higher average interest rates on cash, cash equivalents and short-term
investments. Interest expenses increased $51 million as a result of increased interest expense on the loan formerly guaranteed by the ATSB, including penalty
interest incurred as a result of the bankruptcy proceedings and interest associated with new regional jets. Other, net expense in 2005 was $4 million, as
compared to a gain of $19 million in 2004, due to foreign exchange losses in 2005 and unfavorable mark-to-market adjustments on certain stock options held
by US Airways as compared to 2004. Other, net in 2004 also includes $13 million related to a business interruption insurance recovery and a $2 million gain
on the sale of four aircraft.
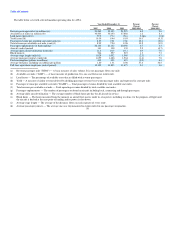
2004 Compared With 2003
Total operating revenues for 2004 were $7.07 billion, as compared to $6.76 billion in 2003, an increase of 4.6%. Mainline passenger revenues increased
$26 million, or 0.5%, as compared to 2003 due to a 5.8% increase in RPMs that increased revenue by $284 million, partially offset by an decrease in yield,
which reduced revenue by $258 million. ASMs increased in 2004 by 3.2%, resulting in an increase in load factor from 73.3% to 75.1% but a decrease in
PRASM of 2.6% to 9.33 cents from 9.58 cents in 2003.
Express passenger revenues were $1.38 billion in 2004, an increase of $171 million, or 14.2%, from 2003 due to an increase in RPMs, which increased
revenue by $454 million, partially offset by a decrease in yield, which decreased revenue by $283 million. US Airways Group's wholly owned subsidiaries
and US Airways' MidAtlantic division increased RPMs by 61.8% as compared to 2004 and RPMs flown by affiliate carriers increased 24.6%. Yield on
US Airways Express decreased 17.0%.
Cargo revenues were flat in 2004 as compared to 2003. Other revenues increased 23.8% from 2003 to 2004 as a result of an increase in service fee
revenue from the wholly owned airline subsidiaries of US Airways Group and affiliate carriers and from revenue associated with certain marketing
arrangements, including revenue generated through airline partner travel after US Airways joined the Star Alliance in May 2004.
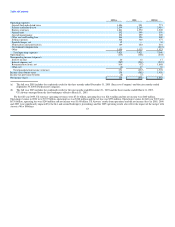
Total operating expenses for 2004 were $7.42 billion, an increase of $415 million, or 5.9%, compared to full year 2003. Mainline operating expenses were
$5.85 billion for 2004, an increase of $113 million, or 1.2%, as compared to full year 2003 on a capacity increase, measured by ASMs, of 3.2%. Mainline
CASM decreased 1.2% to 10.99 cents in 2004 from 11.12 cents in 2003. The 2003 results include special charges of $34 million, which comprises 0.07 cents
of mainline CASM for the period, and government compensation of $212 million, which reduced mainline CASM by 0.41 cents. The decrease in CASM was
due to cost reductions achieved in the fourth quarter of 2004 as a result of the bankruptcy filing related to salaries and related costs, partially offset by
increases in aircraft fuel and related taxes. 66