US Airways 2005 Annual Report Download - page 307
Download and view the complete annual report
Please find page 307 of the 2005 US Airways annual report below. You can navigate through the pages in the report by either clicking on the pages listed below, or by using the keyword search tool below to find specific information within the annual report.-
 1
1 -
2
-
3
-
4
-
5
-
6
-
7
-
8
-
9
-
10
-
11
-
12
-
13
-
14
-
15
-
16
-
17
-
18
-
19
-
20
-
21
-
22
-
23
-
24
-
25
-
26
-
27
-
28
-
29
-
30
-
31
-
32
-
33
-
34
-
35
-
36
-
37
-
38
-
39
-
40
-
41
-
42
-
43
-
44
-
45
-
46
-
47
-
48
-
49
-
50
-
51
-
52
-
53
-
54
-
55
-
56
-
57
-
58
-
59
-
60
-
61
-
62
-
63
-
64
-
65
-
66
-
67
-
68
-
69
-
70
-
71
-
72
-
73
-
74
-
75
-
76
-
77
-
78
-
79
-
80
-
81
-
82
-
83
-
84
-
85
-
86
-
87
-
88
-
89
-
90
-
91
-
92
-
93
-
94
-
95
-
96
-
97
-
98
-
99
-
100
-
101
-
102
-
103
-
104
-
105
-
106
-
107
-
108
-
109
-
110
-
111
-
112
-
113
-
114
-
115
-
116
-
117
-
118
-
119
-
120
-
121
-
122
-
123
-
124
-
125
-
126
-
127
-
128
-
129
-
130
-
131
-
132
-
133
-
134
-
135
-
136
-
137
-
138
-
139
-
140
-
141
-
142
-
143
-
144
-
145
-
146
-
147
-
148
-
149
-
150
-
151
-
152
-
153
-
154
-
155
-
156
-
157
-
158
-
159
-
160
-
161
-
162
-
163
-
164
-
165
-
166
-
167
-
168
-
169
-
170
-
171
-
172
-
173
-
174
-
175
-
176
-
177
-
178
-
179
-
180
-
181
-
182
-
183
-
184
-
185
-
186
-
187
-
188
-
189
-
190
-
191
-
192
-
193
-
194
-
195
-
196
-
197
-
198
-
199
-
200
-
201
-
202
-
203
-
204
-
205
-
206
-
207
-
208
-
209
-
210
-
211
-
212
-
213
-
214
-
215
-
216
-
217
-
218
-
219
-
220
-
221
-
222
-
223
-
224
-
225
-
226
-
227
-
228
-
229
-
230
-
231
-
232
-
233
-
234
-
235
-
236
-
237
-
238
-
239
-
240
-
241
-
242
-
243
-
244
-
245
-
246
-
247
-
248
-
249
-
250
-
251
-
252
-
253
-
254
-
255
-
256
-
257
-
258
-
259
-
260
-
261
-
262
-
263
-
264
-
265
-
266
-
267
-
268
-
269
-
270
-
271
-
272
-
273
-
274
-
275
-
276
-
277
-
278
-
279
-
280
-
281
-
282
-
283
-
284
-
285
-
286
-
287
-
288
-
289
-
290
-
291
-
292
-
293
-
294
-
295
-
296
-
 297
297 -
 298
298 -
 299
299 -
 300
300 -
 301
301 -
 302
302 -
 303
303 -
 304
304 -
 305
305 -
 306
306 -
 307
307 -
 308
308 -
 309
309 -
 310
310 -
 311
311 -
 312
312 -
 313
313 -
 314
314 -
 315
315 -
 316
316 -
 317
317 -
318
-
319
-
320
-
321
-
322
-
323
 |
 |
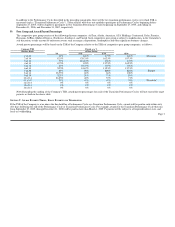
In addition to the Performance Cycles described in the preceding paragraphs, there will be two transition performance cycles over which TSR is
measured (each a "Transition Performance Cycle"). Those officers who were not entitled to participate in Performance Cycles beginning before
September 27, 2005, will be eligible to participate in two Transition Performance Cycles beginning on September 27, 2005, and ending on
December 31, 2006, and December 31, 2007, respectively.
B) Peer Group and Award Payout Percentages
The competitive peer group consists of the following thirteen companies: AirTran, Alaska, American, ATA Holdings, Continental, Delta, Frontier,
Hawaiian, JetBlue, Midwest Express, Northwest, Southwest, and United. Such competitive peer group is subject to modification, in the Committee's
sole discretion, to take account of unforeseen events such as mergers, dispositions, bankruptcies and other significant business changes.
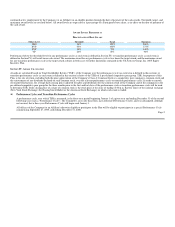
Award payout percentages will be based on the TSR of the Company relative to the TSRs of competitive peer group companies, as follows:
Company TSR Payout as a %
Relative Rank of Base Salary
VP SVP EVP CEO
1 of 14 90% 140% 175% 200% Maximum
2 of 14 82.5% 128.33% 162.5% 187.5%
3 of 14 75% 116.67% 150% 175%
4 of 14 67.5% 105% 137.5% 162.5%
5 of 14 60% 93.33% 125% 150%
6 of 14 52.5% 81.67% 112.5% 137.5%
7 of 14 45% 70% 100% 125% Target
8 of 14 38.75% 60% 86% 108%
9 of 14 32.5% 50% 71% 89%
10 of 14 26.25% 40% 57% 71%
11 of 14 20% 30% 43% 54% Threshold
12 of 14 0% 0% 0% 0%
13 of 14 0% 0% 0% 0%
14 of 14 0% 0% 0% 0%
Notwithstanding the ranking of the Company's TSR, award payout percentages for each of the Transition Performance Cycles will not exceed the target
payouts set forth in the above table.
SECTION V. AWARD PAYMENT TIMING, EARLY PAYMENT AND TERMINATION
If the TSR of the Company is at or above the threshold for a Performance Cycle or a Transition Performance Cycle, awards will be paid in cash within sixty
(60) days following the end of the Performance Cycle or Transition Performance Cycle. For example, awards for the Transition Performance Cycle that runs
from September 27, 2005, through December 31, 2008 will be paid no later than March 1, 2009. Payments will be subject to all required federal, state, and
local tax withholding. Page 3