US Airways 2005 Annual Report Download - page 187
Download and view the complete annual report
Please find page 187 of the 2005 US Airways annual report below. You can navigate through the pages in the report by either clicking on the pages listed below, or by using the keyword search tool below to find specific information within the annual report.-
 1
1 -
2
-
3
-
4
-
5
-
6
-
7
-
8
-
9
-
10
-
11
-
12
-
13
-
14
-
15
-
16
-
17
-
18
-
19
-
20
-
21
-
22
-
23
-
24
-
25
-
26
-
27
-
28
-
29
-
30
-
31
-
32
-
33
-
34
-
35
-
36
-
37
-
38
-
39
-
40
-
41
-
42
-
43
-
44
-
45
-
46
-
47
-
48
-
49
-
50
-
51
-
52
-
53
-
54
-
55
-
56
-
57
-
58
-
59
-
60
-
61
-
62
-
63
-
64
-
65
-
66
-
67
-
68
-
69
-
70
-
71
-
72
-
73
-
74
-
75
-
76
-
77
-
78
-
79
-
80
-
81
-
82
-
83
-
84
-
85
-
86
-
87
-
88
-
89
-
90
-
91
-
92
-
93
-
94
-
95
-
96
-
97
-
98
-
99
-
100
-
101
-
102
-
103
-
104
-
105
-
106
-
107
-
108
-
109
-
110
-
111
-
112
-
113
-
114
-
115
-
116
-
117
-
118
-
119
-
120
-
121
-
122
-
123
-
124
-
125
-
126
-
127
-
128
-
129
-
130
-
131
-
132
-
133
-
134
-
135
-
136
-
137
-
138
-
139
-
140
-
141
-
142
-
143
-
144
-
145
-
146
-
147
-
148
-
149
-
150
-
151
-
152
-
153
-
154
-
155
-
156
-
157
-
158
-
159
-
160
-
161
-
162
-
163
-
164
-
165
-
166
-
167
-
168
-
169
-
170
-
171
-
172
-
173
-
174
-
175
-
176
-
 177
177 -
 178
178 -
 179
179 -
 180
180 -
 181
181 -
 182
182 -
 183
183 -
 184
184 -
 185
185 -
 186
186 -
 187
187 -
 188
188 -
 189
189 -
 190
190 -
 191
191 -
 192
192 -
 193
193 -
 194
194 -
 195
195 -
 196
196 -
 197
197 -
198
-
199
-
200
-
201
-
202
-
203
-
204
-
205
-
206
-
207
-
208
-
209
-
210
-
211
-
212
-
213
-
214
-
215
-
216
-
217
-
218
-
219
-
220
-
221
-
222
-
223
-
224
-
225
-
226
-
227
-
228
-
229
-
230
-
231
-
232
-
233
-
234
-
235
-
236
-
237
-
238
-
239
-
240
-
241
-
242
-
243
-
244
-
245
-
246
-
247
-
248
-
249
-
250
-
251
-
252
-
253
-
254
-
255
-
256
-
257
-
258
-
259
-
260
-
261
-
262
-
263
-
264
-
265
-
266
-
267
-
268
-
269
-
270
-
271
-
272
-
273
-
274
-
275
-
276
-
277
-
278
-
279
-
280
-
281
-
282
-
283
-
284
-
285
-
286
-
287
-
288
-
289
-
290
-
291
-
292
-
293
-
294
-
295
-
296
-
297
-
298
-
299
-
300
-
301
-
302
-
303
-
304
-
305
-
306
-
307
-
308
-
309
-
310
-
311
-
312
-
313
-
314
-
315
-
316
-
317
-
318
-
319
-
320
-
321
-
322
-
323
 |
 |

Table of Contents
America West Airlines, Inc.
Notes to Consolidated Financial Statements — (Continued)
workgroups. As a result, AWA recorded a special charge of $2 million related to this reduction-in-force. All payments were completed as of
December 31, 2005.
(l) In June 2003, AWA recorded an impairment loss of $3 million related to three owned Boeing 737-200 aircraft that were grounded and subsequently
sold.
6. Stock Options and Awards
Certain of AWA's employees are eligible to participate in the 2005 Incentive Equity Plan (the "2005 Incentive Plan"). The 2005 Incentive Plan provides
for the grant of incentive stock options, nonstatutory stock options, stock appreciation rights, stock purchase awards, stock bonus awards, stock unit awards,
and other forms of equity compensation, collectively referred to as stock awards, as well as performance-based cash awards. During 2005, certain of AWA's
employees received restricted stock units and stock appreciation rights to be settled in stock under the 2005 Incentive Plan. Compensation expense related to
these awards totaled $3 million in 2005.
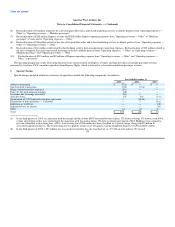
7. Financial Instruments
(a) Fair Value of Financial Instruments
Cash Equivalents, Short-term Investments and Receivables
The carrying amount approximates fair value because of the short-term nature of these instruments.
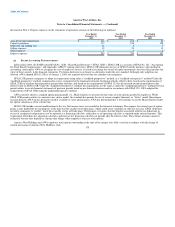
Cash equivalents and short-term investments as of December 31 are classified as follows (in millions):
Held-to-maturity securities: 2005 2004
Cash and cash equivalents:
Corporate notes $ 318 $ —
Cash and money market funds 314 127
U.S. government securities — 1
Total cash and cash equivalents $ 632 $ 128
Short-term investments:
Corporate notes $ 55 $ 69
U.S. government securities — —
Total short-term investments 55 69
Total Held-to-maturity securities: $ 687 $ 197
Available-for-sale securities: 2005 2004
Auction rate securities 264 58
Total short-term investments 264 58
Total Available-for-sale securities $ 264 $ 58
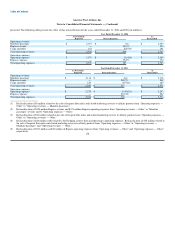
The carrying values of available-for-sale and held-to-maturity securities approximate fair value. There were no unrealized gains or losses on these
investments for the years ended December 31, 2005, 2004 and 2003. Gross proceeds from sales of available-for-sale securities for the years ended
December 31, 2005, 2004 and 2003 were $349 million, $589 million and $322 million, respectively. Contractual maturities of all
181