US Airways 2005 Annual Report Download - page 71
Download and view the complete annual report
Please find page 71 of the 2005 US Airways annual report below. You can navigate through the pages in the report by either clicking on the pages listed below, or by using the keyword search tool below to find specific information within the annual report.-
 1
1 -
2
-
3
-
4
-
5
-
6
-
7
-
8
-
9
-
10
-
11
-
12
-
13
-
14
-
15
-
16
-
17
-
18
-
19
-
20
-
21
-
22
-
23
-
24
-
25
-
26
-
27
-
28
-
29
-
30
-
31
-
32
-
33
-
34
-
35
-
36
-
37
-
38
-
39
-
40
-
41
-
42
-
43
-
44
-
45
-
46
-
47
-
48
-
49
-
50
-
51
-
52
-
53
-
54
-
55
-
56
-
57
-
58
-
59
-
60
-
 61
61 -
 62
62 -
 63
63 -
 64
64 -
 65
65 -
 66
66 -
 67
67 -
 68
68 -
 69
69 -
 70
70 -
 71
71 -
 72
72 -
 73
73 -
 74
74 -
 75
75 -
 76
76 -
 77
77 -
 78
78 -
 79
79 -
 80
80 -
 81
81 -
82
-
83
-
84
-
85
-
86
-
87
-
88
-
89
-
90
-
91
-
92
-
93
-
94
-
95
-
96
-
97
-
98
-
99
-
100
-
101
-
102
-
103
-
104
-
105
-
106
-
107
-
108
-
109
-
110
-
111
-
112
-
113
-
114
-
115
-
116
-
117
-
118
-
119
-
120
-
121
-
122
-
123
-
124
-
125
-
126
-
127
-
128
-
129
-
130
-
131
-
132
-
133
-
134
-
135
-
136
-
137
-
138
-
139
-
140
-
141
-
142
-
143
-
144
-
145
-
146
-
147
-
148
-
149
-
150
-
151
-
152
-
153
-
154
-
155
-
156
-
157
-
158
-
159
-
160
-
161
-
162
-
163
-
164
-
165
-
166
-
167
-
168
-
169
-
170
-
171
-
172
-
173
-
174
-
175
-
176
-
177
-
178
-
179
-
180
-
181
-
182
-
183
-
184
-
185
-
186
-
187
-
188
-
189
-
190
-
191
-
192
-
193
-
194
-
195
-
196
-
197
-
198
-
199
-
200
-
201
-
202
-
203
-
204
-
205
-
206
-
207
-
208
-
209
-
210
-
211
-
212
-
213
-
214
-
215
-
216
-
217
-
218
-
219
-
220
-
221
-
222
-
223
-
224
-
225
-
226
-
227
-
228
-
229
-
230
-
231
-
232
-
233
-
234
-
235
-
236
-
237
-
238
-
239
-
240
-
241
-
242
-
243
-
244
-
245
-
246
-
247
-
248
-
249
-
250
-
251
-
252
-
253
-
254
-
255
-
256
-
257
-
258
-
259
-
260
-
261
-
262
-
263
-
264
-
265
-
266
-
267
-
268
-
269
-
270
-
271
-
272
-
273
-
274
-
275
-
276
-
277
-
278
-
279
-
280
-
281
-
282
-
283
-
284
-
285
-
286
-
287
-
288
-
289
-
290
-
291
-
292
-
293
-
294
-
295
-
296
-
297
-
298
-
299
-
300
-
301
-
302
-
303
-
304
-
305
-
306
-
307
-
308
-
309
-
310
-
311
-
312
-
313
-
314
-
315
-
316
-
317
-
318
-
319
-
320
-
321
-
322
-
323
 |
 |
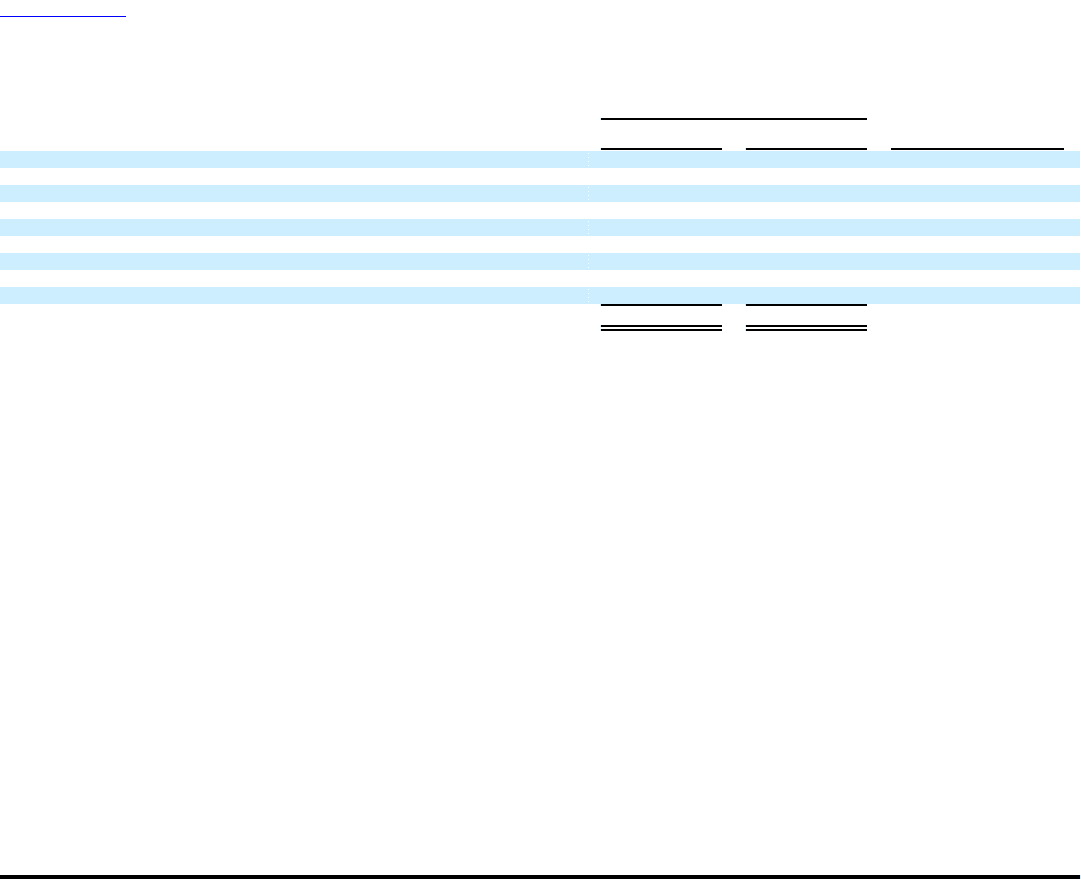
Table of Contents
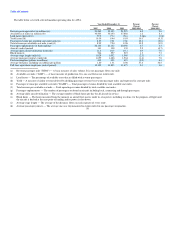
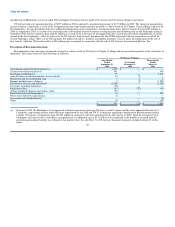
The table below sets forth the major components of US Airways' mainline CASM (in cents):
Year Ended
December 31, Percent
Change
2005 2004 2005-2004
Aircraft fuel and related taxes 2.89 1.86 55.4
Salaries and related costs 2.72 4.07 (33.2)
Aircraft rent 0.76 0.75 1.3
Aircraft maintenance 0.65 0.56 16.1
Other rent and landing fees 0.71 0.74 (4.1)
Selling expenses 0.63 0.68 (7.4)
Special charges, net 0.03 — —
Depreciation and amortization 0.37 0.41 (9.8)
Other 2.04 1.92 6.3
10.80 10.99 (1.7)
Significant changes in the components of mainline CASM are explained as follows:
• Aircraft fuel and related tax expense per ASM increased 55.4% primarily due to a 58.0% increase in the average price per gallon of fuel from $1.12 in
2004 to $1.77 in 2005, partially offset by a 4.8% decrease in consumption.
• Salaries and related costs per ASM decreased 33.2% primarily due to lower wage and benefits rates as a result of the cost-savings agreements achieved
with each of the collective bargaining groups, including the termination of defined benefit pension plans and the curtailment of postretirement benefits,
as well as lower headcount as compared to the same period in 2004.
• Aircraft rent expense per ASM increased 1.3% reflecting a shift in the mix of leased to owned aircraft in 2005 as compared to 2004.
• Aircraft maintenance per ASM increased 16.1% reflecting the shift to outside vendors to perform scheduled maintenance, partially offsetting the
decrease in salaries and related costs described above.
• Other rent and landing fees per ASM decreased 4.1% primarily due to space rent reductions negotiated during the bankruptcy proceedings.
• Selling expenses per ASM decreased 7.4% primarily due to reduction in travel agent commissions and the termination of certain marketing contracts
and reductions in advertising programs as a result of the bankruptcy.
• US Airways recorded $15 million of special charges in the fourth quarter of 2005 related to transition and integration costs associated with the merger.
See note 4 to US Airways' financial statements included in Item 8C of this report.
• Depreciation and amortization decreased 9.8% per ASM as a result of fewer owned aircraft in the operating fleet and lower book values on the
continuing fleet as a result of fresh-start reporting.
• Other operating expenses increased primarily as a result of increases to expenses associated with the redemption of Dividend Miles on partner airlines
and future travel on US Airways as well as increases in costs associated with outsourced aircraft cleaning services. These increases were partially offset
by decreases in insurance expense, outsourced technology services and schedule-related costs including passenger food expenses.
Express expenses are comprised of expenses associated with US Airways' MidAtlantic division, US Airways Group's wholly owned regional airlines and
affiliate regional airlines operating as US Airways Express. Express expenses increased 18.4% to $1.86 billion in 2005 as compared to 2004, reflecting a
65