US Airways 2005 Annual Report Download - page 70
Download and view the complete annual report
Please find page 70 of the 2005 US Airways annual report below. You can navigate through the pages in the report by either clicking on the pages listed below, or by using the keyword search tool below to find specific information within the annual report.-
 1
1 -
2
-
3
-
4
-
5
-
6
-
7
-
8
-
9
-
10
-
11
-
12
-
13
-
14
-
15
-
16
-
17
-
18
-
19
-
20
-
21
-
22
-
23
-
24
-
25
-
26
-
27
-
28
-
29
-
30
-
31
-
32
-
33
-
34
-
35
-
36
-
37
-
38
-
39
-
40
-
41
-
42
-
43
-
44
-
45
-
46
-
47
-
48
-
49
-
50
-
51
-
52
-
53
-
54
-
55
-
56
-
57
-
58
-
59
-
 60
60 -
 61
61 -
 62
62 -
 63
63 -
 64
64 -
 65
65 -
 66
66 -
 67
67 -
 68
68 -
 69
69 -
 70
70 -
 71
71 -
 72
72 -
 73
73 -
 74
74 -
 75
75 -
 76
76 -
 77
77 -
 78
78 -
 79
79 -
 80
80 -
81
-
82
-
83
-
84
-
85
-
86
-
87
-
88
-
89
-
90
-
91
-
92
-
93
-
94
-
95
-
96
-
97
-
98
-
99
-
100
-
101
-
102
-
103
-
104
-
105
-
106
-
107
-
108
-
109
-
110
-
111
-
112
-
113
-
114
-
115
-
116
-
117
-
118
-
119
-
120
-
121
-
122
-
123
-
124
-
125
-
126
-
127
-
128
-
129
-
130
-
131
-
132
-
133
-
134
-
135
-
136
-
137
-
138
-
139
-
140
-
141
-
142
-
143
-
144
-
145
-
146
-
147
-
148
-
149
-
150
-
151
-
152
-
153
-
154
-
155
-
156
-
157
-
158
-
159
-
160
-
161
-
162
-
163
-
164
-
165
-
166
-
167
-
168
-
169
-
170
-
171
-
172
-
173
-
174
-
175
-
176
-
177
-
178
-
179
-
180
-
181
-
182
-
183
-
184
-
185
-
186
-
187
-
188
-
189
-
190
-
191
-
192
-
193
-
194
-
195
-
196
-
197
-
198
-
199
-
200
-
201
-
202
-
203
-
204
-
205
-
206
-
207
-
208
-
209
-
210
-
211
-
212
-
213
-
214
-
215
-
216
-
217
-
218
-
219
-
220
-
221
-
222
-
223
-
224
-
225
-
226
-
227
-
228
-
229
-
230
-
231
-
232
-
233
-
234
-
235
-
236
-
237
-
238
-
239
-
240
-
241
-
242
-
243
-
244
-
245
-
246
-
247
-
248
-
249
-
250
-
251
-
252
-
253
-
254
-
255
-
256
-
257
-
258
-
259
-
260
-
261
-
262
-
263
-
264
-
265
-
266
-
267
-
268
-
269
-
270
-
271
-
272
-
273
-
274
-
275
-
276
-
277
-
278
-
279
-
280
-
281
-
282
-
283
-
284
-
285
-
286
-
287
-
288
-
289
-
290
-
291
-
292
-
293
-
294
-
295
-
296
-
297
-
298
-
299
-
300
-
301
-
302
-
303
-
304
-
305
-
306
-
307
-
308
-
309
-
310
-
311
-
312
-
313
-
314
-
315
-
316
-
317
-
318
-
319
-
320
-
321
-
322
-
323
 |
 |

Table of Contents
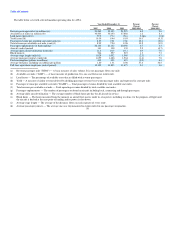
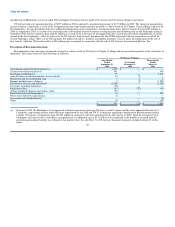
The table below sets forth selected operating data for US Airways' mainline operations.
Year Ended December 31, Percent Percent
Change Change
2005 2004 2003 2005-2004 2004-2003
Mainline:
Revenue passenger miles (in millions) 38,895 39,970 37,796 (2.7) 5.8
Available seat miles (in millions) 51,518 53,229 51,584 (3.2) 3.2
Load factor (percent) 75.5 75.1 73.3 0.4pts 1.8pts
Yield (cents) 12.50 12.43 13.08 0.6 (5.0)
Passenger revenue per available seat mile (cents) 9.44 9.33 9.58 1.2 (2.6)
Passenger enplanements (in thousands) 39,977 41,518 41,264 (3.7) (0.6)
Aircraft (end of period) 232 281 282 (17.4) 0.4
Block hours 928,362 960,678 956,888 (3.4) 0.4
Average stage length (miles) 793 792 761 0.1 4.1
Average passenger journey (miles) 973 963 916 1.0 5.1
Fuel consumption (gallons in millions) 842 884 873 (4.8) 1.3
Average fuel price including tax (dollars per gallon) 1.77 1.12 0.88 58.0 27.3
Average number of full-time equivalent employees 21,486 26,670 26,640 (19.4) 0.1
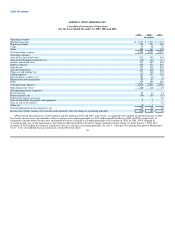
2005 Compared With 2004
Total operating revenues for 2005 were $7.21 billion, as compared to $7.07 billion in 2004, an increase of 2.0%. Passenger revenue in the early part of
2005 was negatively impacted by US Airways' bankruptcy proceedings. Mainline passenger revenues declined $108 million, or 2.2%, as compared to 2004
due to a 2.7% decrease in RPMs that reduced revenue by $134 million, partially offset by an increase in rate, or yield, which increased revenue by
$26 million. ASMs decreased in 2005 by 3.2%, resulting in an increase in load factor from 75.1% to 75.5% and a PRASM increase of 1.2% from 9.33 cents to
9.44 cents.
Express passenger revenues were $1.62 billion in 2005, an increase of $241 million, or 17.5%, from 2004 due to an increase in RPMs, which increased
revenue by $408 million, partially offset by a decrease in yield, which reduced revenue by $167 million. US Airways Group's wholly owned subsidiaries and
US Airways' MidAtlantic division, which began service in April 2004, increased RPMs by 66.4% as compared to 2004, and RPMs flown by affiliate carriers
increased 4.0%. The yield for US Airways Express operations decreased 9.4% as compared to 2004 due to longer stage length and the deployment of regional
jets into mainline markets.
Cargo revenues decreased $37 million in 2005 primarily due to lower volume. Other revenues increased 7.3% in 2005 primarily due to revenue generated
through airline partner travel after US Airways joined the Star Alliance in May 2004 and an increase in marketing revenue related to miles sold to credit card
and other partners.
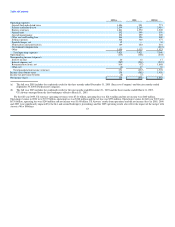
Total operating expenses for full year 2005 were $7.43 billion, an increase of $4 million, or 0.1%, compared to 2004. Mainline operating expenses were
$5.56 billion for full year 2005, a decrease of $285 million as compared to 2004. Mainline cost per available seat mile (mainline CASM) decreased 1.7% to
10.80 cents in 2005 from 10.99 cents in 2004. The 2005 results include special charges of $15 million, which comprised 0.03 cents of mainline CASM for the
period. The decrease in CASM was due to cost reductions achieved as a result of the bankruptcy proceedings, primarily related to salaries and related costs,
partially offset by increases in aircraft fuel and related taxes. 64