US Airways 2005 Annual Report Download - page 44
Download and view the complete annual report
Please find page 44 of the 2005 US Airways annual report below. You can navigate through the pages in the report by either clicking on the pages listed below, or by using the keyword search tool below to find specific information within the annual report.-
 1
1 -
2
-
3
-
4
-
5
-
6
-
7
-
8
-
9
-
10
-
11
-
12
-
13
-
14
-
15
-
16
-
17
-
18
-
19
-
20
-
21
-
22
-
23
-
24
-
25
-
26
-
27
-
28
-
29
-
30
-
31
-
32
-
33
-
 34
34 -
 35
35 -
 36
36 -
 37
37 -
 38
38 -
 39
39 -
 40
40 -
 41
41 -
 42
42 -
 43
43 -
 44
44 -
 45
45 -
 46
46 -
 47
47 -
 48
48 -
 49
49 -
 50
50 -
 51
51 -
 52
52 -
 53
53 -
 54
54 -
55
-
56
-
57
-
58
-
59
-
60
-
61
-
62
-
63
-
64
-
65
-
66
-
67
-
68
-
69
-
70
-
71
-
72
-
73
-
74
-
75
-
76
-
77
-
78
-
79
-
80
-
81
-
82
-
83
-
84
-
85
-
86
-
87
-
88
-
89
-
90
-
91
-
92
-
93
-
94
-
95
-
96
-
97
-
98
-
99
-
100
-
101
-
102
-
103
-
104
-
105
-
106
-
107
-
108
-
109
-
110
-
111
-
112
-
113
-
114
-
115
-
116
-
117
-
118
-
119
-
120
-
121
-
122
-
123
-
124
-
125
-
126
-
127
-
128
-
129
-
130
-
131
-
132
-
133
-
134
-
135
-
136
-
137
-
138
-
139
-
140
-
141
-
142
-
143
-
144
-
145
-
146
-
147
-
148
-
149
-
150
-
151
-
152
-
153
-
154
-
155
-
156
-
157
-
158
-
159
-
160
-
161
-
162
-
163
-
164
-
165
-
166
-
167
-
168
-
169
-
170
-
171
-
172
-
173
-
174
-
175
-
176
-
177
-
178
-
179
-
180
-
181
-
182
-
183
-
184
-
185
-
186
-
187
-
188
-
189
-
190
-
191
-
192
-
193
-
194
-
195
-
196
-
197
-
198
-
199
-
200
-
201
-
202
-
203
-
204
-
205
-
206
-
207
-
208
-
209
-
210
-
211
-
212
-
213
-
214
-
215
-
216
-
217
-
218
-
219
-
220
-
221
-
222
-
223
-
224
-
225
-
226
-
227
-
228
-
229
-
230
-
231
-
232
-
233
-
234
-
235
-
236
-
237
-
238
-
239
-
240
-
241
-
242
-
243
-
244
-
245
-
246
-
247
-
248
-
249
-
250
-
251
-
252
-
253
-
254
-
255
-
256
-
257
-
258
-
259
-
260
-
261
-
262
-
263
-
264
-
265
-
266
-
267
-
268
-
269
-
270
-
271
-
272
-
273
-
274
-
275
-
276
-
277
-
278
-
279
-
280
-
281
-
282
-
283
-
284
-
285
-
286
-
287
-
288
-
289
-
290
-
291
-
292
-
293
-
294
-
295
-
296
-
297
-
298
-
299
-
300
-
301
-
302
-
303
-
304
-
305
-
306
-
307
-
308
-
309
-
310
-
311
-
312
-
313
-
314
-
315
-
316
-
317
-
318
-
319
-
320
-
321
-
322
-
323
 |
 |
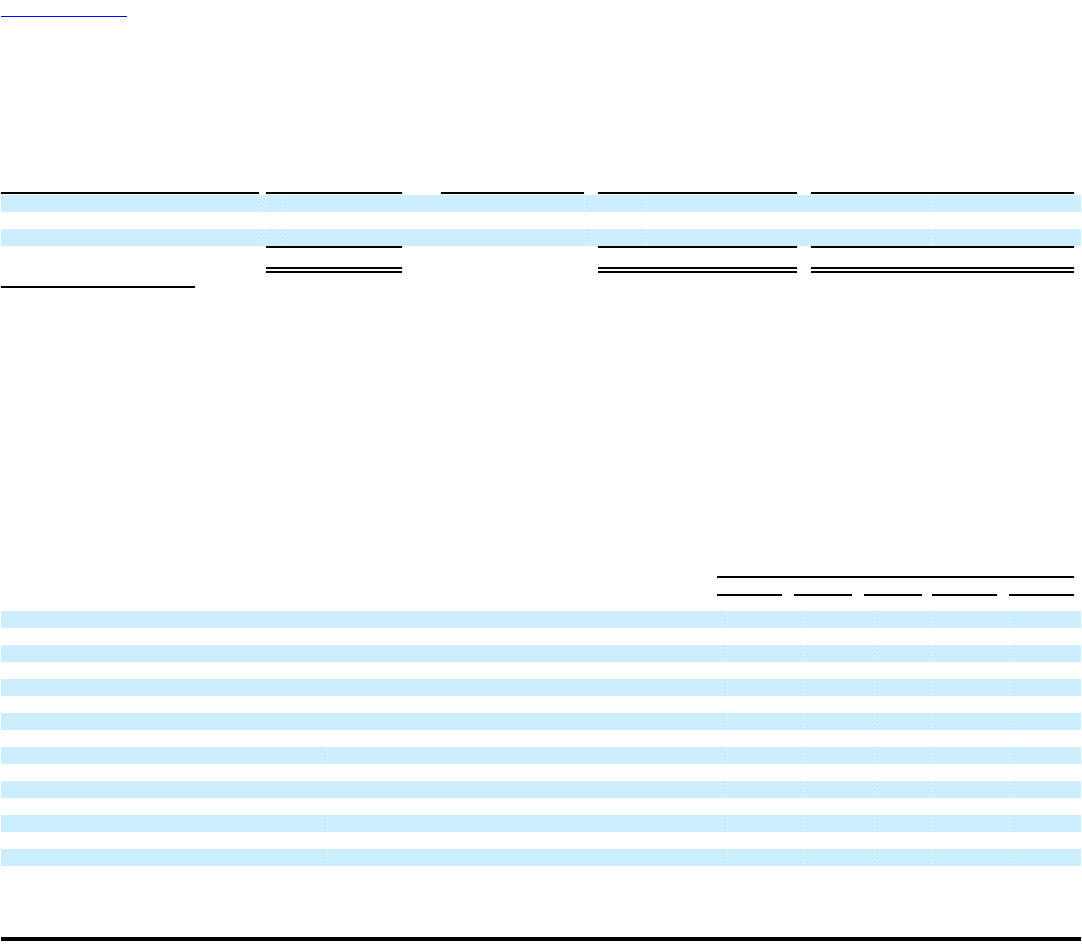
Table of Contents
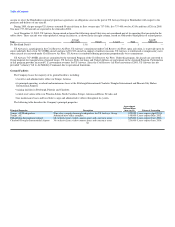
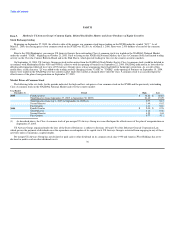
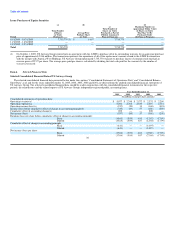
Issuer Purchases of Equity Securities
(a) (b) (d)
(c) Maximum Number (or
Total Number of Approximate Dollar Value)
Total Number Shares (or Units) of Shares (or Units)
of Shares Average Price Purchased as Part of That May Yet Be
(or Units) Paid per Share Publicly Announced Purchased Under
Period Purchased (or Unit) Plans or Programs the Plans or Programs
10/1/2005 - 10/31/2005 7,735,770(1) $ 14.97 7,735,770 —
11/1/2005 - 11/30/2005 — — — —
12/1/2005 - 12/31/2005 — — — —
Total 7,735,770 7,735,770 —
(1) On October 1, 2005, US Airways Group entered into an agreement with the ATSB to purchase all of its outstanding warrants for an aggregate purchase
price of approximately $116 million. The transaction represents the repurchase of all of the replacement warrants issued to the ATSB in connection
with the merger with America West Holdings. US Airways Group repurchased 7,735,770 warrants to purchase shares of common stock that had an
exercise price of $7.27 per share. The average price paid per share is calculated by dividing the total cash paid for the warrants by the number of
warrants purchased.
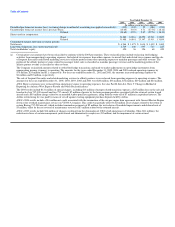
Item 6. Selected Financial Data
Selected Consolidated Financial Data of US Airways Group
The selected consolidated financial data presented below under the captions "Consolidated Statements of Operations Data" and "Consolidated Balance
Sheet Data" as of and for the years ended December 31, 2005, 2004, 2003, 2002 and 2001 are derived from the audited consolidated financial statements of
US Airways Group. The selected consolidated financial data should be read in conjunction with the consolidated financial statements for the respective
periods, the related notes and the related reports of US Airways Group's independent registered public accounting firms.
Year Ended December 31,
2005 2004 2003 2002 2001
(In millions except per share amounts)
Consolidated statements of operations data:
Operating revenues(a) $ 5,077 $ 2,748 $ 2,572 $ 2,337 $ 2,296
Operating expenses(a) 5,294 2,768 2,539 2,497 2,714
Operating income (loss)(a) (217) (20) 33 (160) (418)
Income (loss) before cumulative effect of change in accounting principle(b) (335) (89) 57 (180) (250)
Cumulative effect of accounting change(c) 202 — — 208 —
Net income (loss) (537) (89) 57 (388) (250)
Earnings (loss) per share before cumulative effect of change in accounting principle:
Basic (10.65) (5.99) 4.03 (12.92) (17.99)
Diluted (10.65) (5.99) 3.07 (12.92) (17.99)
Cumulative effect of change in accounting principle
Basic (6.41) — — (14.97) —
Diluted (6.41) — — (14.97) —
Net income (loss) per share:
Basic (17.06) (5.99) 4.03 (27.89) (17.99)
Diluted (17.06) (5.99) 3.07 (27.89) (17.99)
38