Travelers 2015 Annual Report Download - page 96
Download and view the complete annual report
Please find page 96 of the 2015 Travelers annual report below. You can navigate through the pages in the report by either clicking on the pages listed below, or by using the keyword search tool below to find specific information within the annual report.-
 1
1 -
2
-
3
-
4
-
5
-
6
-
7
-
8
-
9
-
10
-
11
-
12
-
13
-
14
-
15
-
16
-
17
-
18
-
19
-
20
-
21
-
22
-
23
-
24
-
25
-
26
-
27
-
28
-
29
-
30
-
31
-
32
-
33
-
34
-
35
-
36
-
37
-
38
-
39
-
40
-
41
-
42
-
43
-
44
-
45
-
46
-
47
-
48
-
49
-
50
-
51
-
52
-
53
-
54
-
55
-
56
-
57
-
58
-
59
-
60
-
61
-
62
-
63
-
64
-
65
-
66
-
67
-
68
-
69
-
70
-
71
-
72
-
73
-
74
-
75
-
76
-
77
-
78
-
79
-
80
-
81
-
82
-
83
-
84
-
85
-
 86
86 -
 87
87 -
 88
88 -
 89
89 -
 90
90 -
 91
91 -
 92
92 -
 93
93 -
 94
94 -
 95
95 -
 96
96 -
 97
97 -
 98
98 -
 99
99 -
 100
100 -
 101
101 -
 102
102 -
 103
103 -
 104
104 -
 105
105 -
 106
106 -
107
-
108
-
109
-
110
-
111
-
112
-
113
-
114
-
115
-
116
-
117
-
118
-
119
-
120
-
121
-
122
-
123
-
124
-
125
-
126
-
127
-
128
-
129
-
130
-
131
-
132
-
133
-
134
-
135
-
136
-
137
-
138
-
139
-
140
-
141
-
142
-
143
-
144
-
145
-
146
-
147
-
148
-
149
-
150
-
151
-
152
-
153
-
154
-
155
-
156
-
157
-
158
-
159
-
160
-
161
-
162
-
163
-
164
-
165
-
166
-
167
-
168
-
169
-
170
-
171
-
172
-
173
-
174
-
175
-
176
-
177
-
178
-
179
-
180
-
181
-
182
-
183
-
184
-
185
-
186
-
187
-
188
-
189
-
190
-
191
-
192
-
193
-
194
-
195
-
196
-
197
-
198
-
199
-
200
-
201
-
202
-
203
-
204
-
205
-
206
-
207
-
208
-
209
-
210
-
211
-
212
-
213
-
214
-
215
-
216
-
217
-
218
-
219
-
220
-
221
-
222
-
223
-
224
-
225
-
226
-
227
-
228
-
229
-
230
-
231
-
232
-
233
-
234
-
235
-
236
-
237
-
238
-
239
-
240
-
241
-
242
-
243
-
244
-
245
-
246
-
247
-
248
-
249
-
250
-
251
-
252
-
253
-
254
-
255
-
256
-
257
-
258
-
259
-
260
-
261
-
262
-
263
-
264
-
265
-
266
-
267
-
268
-
269
-
270
-
271
-
272
-
273
-
274
-
275
-
276
-
277
-
278
-
279
-
280
-
281
-
282
-
283
-
284
-
285
-
286
-
287
 |
 |

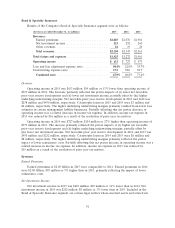
Combined Ratio
The combined ratio of 86.6% in 2015 was 2.1 points lower than the combined ratio of 88.7% in
2014.
The loss and loss adjustment expense ratio of 58.1% in 2015 was 1.5 points lower than the 2014
ratio of 59.6%. Catastrophe losses accounted for 3.6 points and 4.7 points of the 2015 and 2014 loss
and loss adjustment expense ratio, respectively. Net favorable prior year reserve development in 2015
and 2014 provided 3.8 points and 2.4 points of benefit to the loss and loss adjustment expense ratio,
respectively. The 2015 underlying loss and loss adjustment expense ratio was 1.0 point higher than the
2014 ratio on the same basis, primarily reflecting the impact of a higher mix of new business versus
renewal business, as well as a higher mix of automobile business versus homeowners and other
business.
The underwriting expense ratio of 28.5% in 2015 was 0.6 points lower than the underwriting
expense ratio of 29.1% in 2014, primarily reflecting lower commission expenses.
The combined ratio of 88.7% in 2014 was 0.2 points lower than the combined ratio of 88.9% in
2013.
The loss and loss adjustment expense ratio of 59.6% in 2014 was 0.5 points higher than the loss
and loss adjustment expense ratio of 59.1% in 2013. Catastrophe losses accounted for 4.7 points and
3.4 points of the 2014 and 2013 loss and loss adjustment expense ratios, respectively. Net favorable
prior year reserve development in 2014 and 2013 provided 2.4 points and 2.8 points of benefit,
respectively, to the loss and loss adjustment expense ratio. The 2014 underlying loss and loss
adjustment expense ratio was 1.2 points lower than the 2013 ratio on the same basis, primarily
reflecting (i) earned pricing that exceeded loss cost trends and (ii) the benefit of the Company’s
previously announced expense reduction initiatives, partially offset by (iii) the impact of a higher mix of
new business versus renewal business.
The underwriting expense ratio of 29.1% in 2014 was 0.7 points lower than the underwriting
expense ratio of 29.8% in 2013. The decrease in 2014 primarily reflected (i) lower homeowners’
commission rates and (ii) the benefit of the Company’s expense reduction initiatives, partially offset by
(iii) higher underwriting expenses resulting from higher new business levels and (iv) a decrease in
earned premiums.
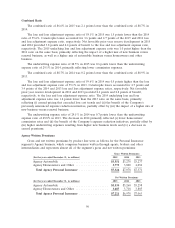
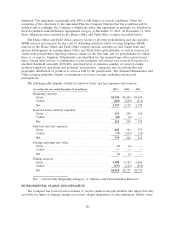
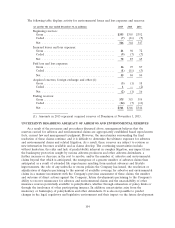
Agency Written Premiums
Gross and net written premiums by product line were as follows for the Personal Insurance
segment’s Agency business, which comprises business written through agents, brokers and other
intermediaries and represents almost all of the segment’s gross and net written premiums:
Gross Written Premiums
(for the year ended December 31, in millions) 2015 2014 2013
Agency Automobile ............................ $3,551 $3,278 $3,277
Agency Homeowners and Other ................... 3,773 3,800 4,094
Total Agency Personal Insurance ................. $7,324 $7,078 $7,371
Net Written Premiums
(for the year ended December 31, in millions) 2015 2014 2013
Agency Automobile ............................ $3,534 $3,260 $3,258
Agency Homeowners and Other ................... 3,687 3,718 3,805
Total Agency Personal Insurance ................. $7,221 $6,978 $7,063
96