Travelers 2015 Annual Report Download - page 120
Download and view the complete annual report
Please find page 120 of the 2015 Travelers annual report below. You can navigate through the pages in the report by either clicking on the pages listed below, or by using the keyword search tool below to find specific information within the annual report.-
 1
1 -
2
-
3
-
4
-
5
-
6
-
7
-
8
-
9
-
10
-
11
-
12
-
13
-
14
-
15
-
16
-
17
-
18
-
19
-
20
-
21
-
22
-
23
-
24
-
25
-
26
-
27
-
28
-
29
-
30
-
31
-
32
-
33
-
34
-
35
-
36
-
37
-
38
-
39
-
40
-
41
-
42
-
43
-
44
-
45
-
46
-
47
-
48
-
49
-
50
-
51
-
52
-
53
-
54
-
55
-
56
-
57
-
58
-
59
-
60
-
61
-
62
-
63
-
64
-
65
-
66
-
67
-
68
-
69
-
70
-
71
-
72
-
73
-
74
-
75
-
76
-
77
-
78
-
79
-
80
-
81
-
82
-
83
-
84
-
85
-
86
-
87
-
88
-
89
-
90
-
91
-
92
-
93
-
94
-
95
-
96
-
97
-
98
-
99
-
100
-
101
-
102
-
103
-
104
-
105
-
106
-
107
-
108
-
109
-
 110
110 -
 111
111 -
 112
112 -
 113
113 -
 114
114 -
 115
115 -
 116
116 -
 117
117 -
 118
118 -
 119
119 -
 120
120 -
 121
121 -
 122
122 -
 123
123 -
 124
124 -
 125
125 -
 126
126 -
 127
127 -
 128
128 -
 129
129 -
 130
130 -
131
-
132
-
133
-
134
-
135
-
136
-
137
-
138
-
139
-
140
-
141
-
142
-
143
-
144
-
145
-
146
-
147
-
148
-
149
-
150
-
151
-
152
-
153
-
154
-
155
-
156
-
157
-
158
-
159
-
160
-
161
-
162
-
163
-
164
-
165
-
166
-
167
-
168
-
169
-
170
-
171
-
172
-
173
-
174
-
175
-
176
-
177
-
178
-
179
-
180
-
181
-
182
-
183
-
184
-
185
-
186
-
187
-
188
-
189
-
190
-
191
-
192
-
193
-
194
-
195
-
196
-
197
-
198
-
199
-
200
-
201
-
202
-
203
-
204
-
205
-
206
-
207
-
208
-
209
-
210
-
211
-
212
-
213
-
214
-
215
-
216
-
217
-
218
-
219
-
220
-
221
-
222
-
223
-
224
-
225
-
226
-
227
-
228
-
229
-
230
-
231
-
232
-
233
-
234
-
235
-
236
-
237
-
238
-
239
-
240
-
241
-
242
-
243
-
244
-
245
-
246
-
247
-
248
-
249
-
250
-
251
-
252
-
253
-
254
-
255
-
256
-
257
-
258
-
259
-
260
-
261
-
262
-
263
-
264
-
265
-
266
-
267
-
268
-
269
-
270
-
271
-
272
-
273
-
274
-
275
-
276
-
277
-
278
-
279
-
280
-
281
-
282
-
283
-
284
-
285
-
286
-
287
 |
 |
adjustment expense reserves, or if changes in the estimated level of claims and claim adjustment
expense reserves are necessary, our financial results could be materially and adversely affected’’ herein.
In Business and International Insurance, the Company expects underlying underwriting margins in
2016 will be broadly consistent with those in 2015, reflecting lower (and more normalized) levels of
what the Company defines as large losses and non-catastrophe weather-related losses.
In Bond & Specialty Insurance, the Company expects underlying underwriting margins in 2016 will
be broadly consistent with those in 2015.
In Personal Insurance, the Company expects underlying underwriting margins in 2016 will be lower
than in 2015. In Agency Automobile, the Company expects underlying underwriting margins in 2016
will be slightly lower than in 2015, reflecting a higher mix of new business versus renewal business. In
Agency Homeowners and Other, the Company expects underlying underwriting margins in 2016 will be
lower than in 2015, reflecting higher (and more normalized) levels of loss activity. Also in Personal
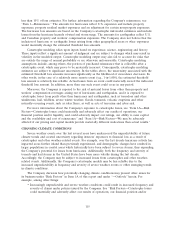
Insurance, the Company’s direct to consumer initiative, the distribution channel that the Company
launched in 2009, while intended to enhance the Company’s long-term ability to compete successfully in
a consumer-driven marketplace, is expected to remain modest with respect to premium volume and
remain unprofitable for a number of years as this book of business grows and matures.
Consolidation within the insurance industry, including among insurance companies, reinsurance
companies and brokers and independent insurance agencies, could alter the competitive environment in
which the Company operates, positively or negatively, which may impact the Company’s premium
volume, the rate it can charge for its products, and the terms on which its products are offered.
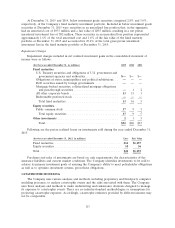
Investment Portfolio. The Company expects to continue to focus its investment strategy on
maintaining a high-quality investment portfolio and a relatively short average effective duration. The
average effective duration of fixed maturities and short-term securities was 3.9 (4.2 excluding short-term
securities) at December 31, 2015. From time to time, the Company enters into short positions in U.S.
Treasury futures contracts to manage the duration of its fixed maturity portfolio. At December 31,
2015, the Company had $400 million notional value of open U.S. Treasury futures contracts. The
Company continually evaluates its investment alternatives and mix. Currently, the majority of the
Company’s investments are comprised of a widely diversified portfolio of high-quality, liquid, taxable
U.S. government, tax-exempt U.S. municipal and taxable corporate and U.S. agency mortgage-backed
bonds.
The Company also invests much smaller amounts in equity securities, real estate, private equity
limited partnerships, hedge funds, and real estate partnerships and joint ventures. These investment
classes have the potential for higher returns but also the potential for higher degrees of risk, including
less stable rates of return and less liquidity.
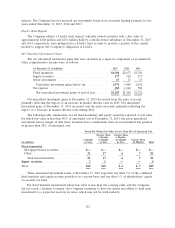
Net investment income is a material contributor to the Company’s results of operations. Interest
rates remain at very low levels by historical standards. Based on the current interest rate environment,
the Company estimates that the impacts of lower reinvestment yields and a lower level of fixed
maturity investments could, in 2016, result in approximately $25 million to $30 million of lower
after-tax net investment income from that portfolio on a quarterly basis as compared to the
corresponding periods of 2015. Net investment income from the non-fixed maturity investment portfolio
in 2015 was lower than in 2014. Particularly given the recent levels of market volatility, there is more
than the usual uncertainty as to the impact of future market conditions on net investment income from
the non-fixed maturity investment portfolio in 2016. If general economic conditions and/or investment
market conditions deteriorate during 2016, the Company could experience a further reduction in net
investment income and/or significant realized investment losses, including impairments.
The Company had a net pretax unrealized investment gain of $1.78 billion ($1.16 billion after-tax)
in its fixed maturity investment portfolio at December 31, 2015. While the Company does not attempt
to predict future interest rate movements, a rising interest rate environment would reduce the market
120