Travelers 2015 Annual Report Download - page 231
Download and view the complete annual report
Please find page 231 of the 2015 Travelers annual report below. You can navigate through the pages in the report by either clicking on the pages listed below, or by using the keyword search tool below to find specific information within the annual report.-
 1
1 -
2
-
3
-
4
-
5
-
6
-
7
-
8
-
9
-
10
-
11
-
12
-
13
-
14
-
15
-
16
-
17
-
18
-
19
-
20
-
21
-
22
-
23
-
24
-
25
-
26
-
27
-
28
-
29
-
30
-
31
-
32
-
33
-
34
-
35
-
36
-
37
-
38
-
39
-
40
-
41
-
42
-
43
-
44
-
45
-
46
-
47
-
48
-
49
-
50
-
51
-
52
-
53
-
54
-
55
-
56
-
57
-
58
-
59
-
60
-
61
-
62
-
63
-
64
-
65
-
66
-
67
-
68
-
69
-
70
-
71
-
72
-
73
-
74
-
75
-
76
-
77
-
78
-
79
-
80
-
81
-
82
-
83
-
84
-
85
-
86
-
87
-
88
-
89
-
90
-
91
-
92
-
93
-
94
-
95
-
96
-
97
-
98
-
99
-
100
-
101
-
102
-
103
-
104
-
105
-
106
-
107
-
108
-
109
-
110
-
111
-
112
-
113
-
114
-
115
-
116
-
117
-
118
-
119
-
120
-
121
-
122
-
123
-
124
-
125
-
126
-
127
-
128
-
129
-
130
-
131
-
132
-
133
-
134
-
135
-
136
-
137
-
138
-
139
-
140
-
141
-
142
-
143
-
144
-
145
-
146
-
147
-
148
-
149
-
150
-
151
-
152
-
153
-
154
-
155
-
156
-
157
-
158
-
159
-
160
-
161
-
162
-
163
-
164
-
165
-
166
-
167
-
168
-
169
-
170
-
171
-
172
-
173
-
174
-
175
-
176
-
177
-
178
-
179
-
180
-
181
-
182
-
183
-
184
-
185
-
186
-
187
-
188
-
189
-
190
-
191
-
192
-
193
-
194
-
195
-
196
-
197
-
198
-
199
-
200
-
201
-
202
-
203
-
204
-
205
-
206
-
207
-
208
-
209
-
210
-
211
-
212
-
213
-
214
-
215
-
216
-
217
-
218
-
219
-
220
-
 221
221 -
 222
222 -
 223
223 -
 224
224 -
 225
225 -
 226
226 -
 227
227 -
 228
228 -
 229
229 -
 230
230 -
 231
231 -
 232
232 -
 233
233 -
 234
234 -
 235
235 -
 236
236 -
 237
237 -
 238
238 -
 239
239 -
 240
240 -
 241
241 -
242
-
243
-
244
-
245
-
246
-
247
-
248
-
249
-
250
-
251
-
252
-
253
-
254
-
255
-
256
-
257
-
258
-
259
-
260
-
261
-
262
-
263
-
264
-
265
-
266
-
267
-
268
-
269
-
270
-
271
-
272
-
273
-
274
-
275
-
276
-
277
-
278
-
279
-
280
-
281
-
282
-
283
-
284
-
285
-
286
-
287
 |
 |
THE TRAVELERS COMPANIES, INC. AND SUBSIDIARIES
NOTES TO CONSOLIDATED FINANCIAL STATEMENTS (Continued)
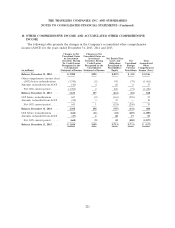
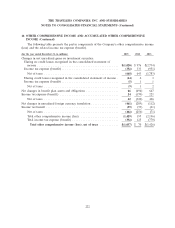
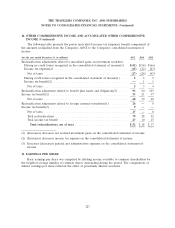
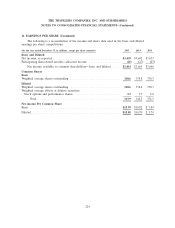
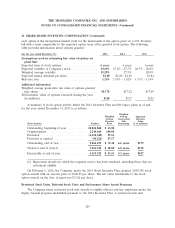
13. SHARE-BASED INCENTIVE COMPENSATION (Continued)
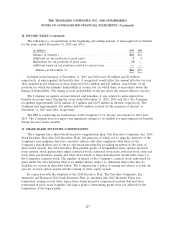
In addition to the nonvested shares presented in the above table, there are related nonvested
dividend equivalent shares. The number of nonvested dividend equivalent shares related to deferred
stock units was 387 at the beginning of the year and 396 at the end of the year and the number of
nonvested dividend equivalent shares related to performance shares was 38,738 at the beginning of the
year and 40,663 at the end of the year. The dividend equivalent shares are subject to the same vesting
terms as the deferred stock units and performance shares.
On February 2, 2016, the Company, under the 2014 Stock Incentive Plan, granted 1,094,685
common stock awards in the form of restricted stock units, deferred stock units and performance share
awards to participating officers, non-employee directors and other key employees. The restricted stock
units and deferred stock units totaled 618,274 shares while the performance share awards totaled
476,411 shares. The fair value per share attributable to the common stock awards on the date of grant
was $106.03.
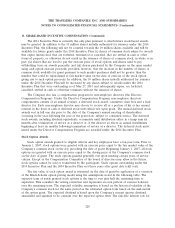
Share-Based Compensation Cost Recognition
The amount of compensation cost for awards subject to a service condition is based on the number
of shares expected to be issued and is recognized over the time period for which service is to be
provided (requisite service period). Awards granted to retiree-eligible employees or to employees who
become retiree-eligible before an award’s vesting date are considered to have met the requisite service
condition. The compensation cost for awards subject to a performance condition is based upon the
probable outcome of the performance condition, which on the grant date reflects an estimate of
attaining 100% of the performance shares granted. The compensation cost reflects an estimated annual
forfeiture rate from 3.0% to 4.5% over the requisite service period of the awards. That estimate is
revised if subsequent information indicates that the actual number of instruments expected to vest is
likely to differ from previous estimates. Compensation costs for awards are recognized on a straight-
line basis over the requisite service period. For awards that have graded vesting terms, the
compensation cost is recognized on a straight-line basis over the requisite service period for each
separate vesting portion of the award as if the award was, in substance, multiple awards. The total
compensation cost for all share-based incentive compensation awards recognized in earnings for the
years ended December 31, 2015, 2014 and 2013 was $141 million, $138 million and $129 million,
respectively. Included in these amounts are compensation cost adjustments of $8 million, $14 million
and $8 million, for the years ended December 31, 2015, 2014 and 2013, respectively, that reflected the
cost associated with the updated estimate of performance shares due to attaining certain performance
levels from the date of the initial grant of the performance awards. The related tax benefits recognized
in earnings were $47 million, $47 million and $45 million for the years ended December 31, 2015, 2014
and 2013, respectively.
At December 31, 2015, there was $124 million of total unrecognized compensation cost related to
all nonvested share-based incentive compensation awards. This includes stock options, restricted and
deferred stock units and performance shares granted under the 2014 Incentive Plan and the 2004
Incentive Plan. The unrecognized compensation cost is expected to be recognized over a weighted-
average period of 1.7 years. Cash received from the exercise of employee stock options under share-
based compensation plans totaled $183 million and $195 million in 2015 and 2014, respectively. The tax
benefit realized for tax deductions from employee stock options exercised during 2015 and 2014 totaled
$41 million and $40 million, respectively.
231