Travelers 2015 Annual Report Download - page 189
Download and view the complete annual report
Please find page 189 of the 2015 Travelers annual report below. You can navigate through the pages in the report by either clicking on the pages listed below, or by using the keyword search tool below to find specific information within the annual report.-
 1
1 -
2
-
3
-
4
-
5
-
6
-
7
-
8
-
9
-
10
-
11
-
12
-
13
-
14
-
15
-
16
-
17
-
18
-
19
-
20
-
21
-
22
-
23
-
24
-
25
-
26
-
27
-
28
-
29
-
30
-
31
-
32
-
33
-
34
-
35
-
36
-
37
-
38
-
39
-
40
-
41
-
42
-
43
-
44
-
45
-
46
-
47
-
48
-
49
-
50
-
51
-
52
-
53
-
54
-
55
-
56
-
57
-
58
-
59
-
60
-
61
-
62
-
63
-
64
-
65
-
66
-
67
-
68
-
69
-
70
-
71
-
72
-
73
-
74
-
75
-
76
-
77
-
78
-
79
-
80
-
81
-
82
-
83
-
84
-
85
-
86
-
87
-
88
-
89
-
90
-
91
-
92
-
93
-
94
-
95
-
96
-
97
-
98
-
99
-
100
-
101
-
102
-
103
-
104
-
105
-
106
-
107
-
108
-
109
-
110
-
111
-
112
-
113
-
114
-
115
-
116
-
117
-
118
-
119
-
120
-
121
-
122
-
123
-
124
-
125
-
126
-
127
-
128
-
129
-
130
-
131
-
132
-
133
-
134
-
135
-
136
-
137
-
138
-
139
-
140
-
141
-
142
-
143
-
144
-
145
-
146
-
147
-
148
-
149
-
150
-
151
-
152
-
153
-
154
-
155
-
156
-
157
-
158
-
159
-
160
-
161
-
162
-
163
-
164
-
165
-
166
-
167
-
168
-
169
-
170
-
171
-
172
-
173
-
174
-
175
-
176
-
177
-
178
-
 179
179 -
 180
180 -
 181
181 -
 182
182 -
 183
183 -
 184
184 -
 185
185 -
 186
186 -
 187
187 -
 188
188 -
 189
189 -
 190
190 -
 191
191 -
 192
192 -
 193
193 -
 194
194 -
 195
195 -
 196
196 -
 197
197 -
 198
198 -
 199
199 -
200
-
201
-
202
-
203
-
204
-
205
-
206
-
207
-
208
-
209
-
210
-
211
-
212
-
213
-
214
-
215
-
216
-
217
-
218
-
219
-
220
-
221
-
222
-
223
-
224
-
225
-
226
-
227
-
228
-
229
-
230
-
231
-
232
-
233
-
234
-
235
-
236
-
237
-
238
-
239
-
240
-
241
-
242
-
243
-
244
-
245
-
246
-
247
-
248
-
249
-
250
-
251
-
252
-
253
-
254
-
255
-
256
-
257
-
258
-
259
-
260
-
261
-
262
-
263
-
264
-
265
-
266
-
267
-
268
-
269
-
270
-
271
-
272
-
273
-
274
-
275
-
276
-
277
-
278
-
279
-
280
-
281
-
282
-
283
-
284
-
285
-
286
-
287
 |
 |

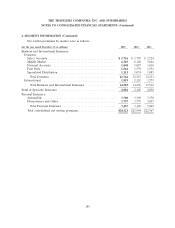
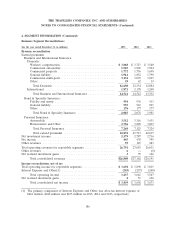
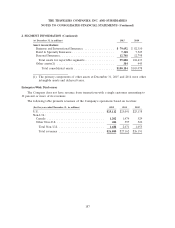
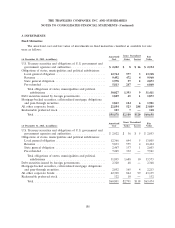
THE TRAVELERS COMPANIES, INC. AND SUBSIDIARIES
NOTES TO CONSOLIDATED FINANCIAL STATEMENTS (Continued)
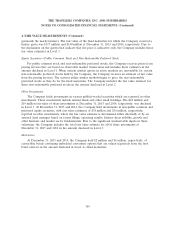
3. INVESTMENTS (Continued)
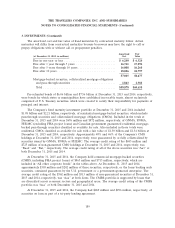
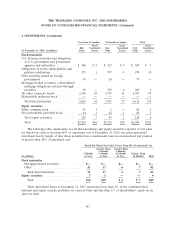
The amortized cost and fair value of fixed maturities by contractual maturity follow. Actual
maturities will differ from contractual maturities because borrowers may have the right to call or
prepay obligations with or without call or prepayment penalties.
Amortized Fair
(at December 31, 2015, in millions) Cost Value
Due in one year or less .............................. $ 6,240 $ 6,324
Due after 1 year through 5 years ....................... 16,741 17,296
Due after 5 years through 10 years ...................... 16,008 16,260
Due after 10 years .................................. 18,026 18,797
57,015 58,677
Mortgage-backed securities, collateralized mortgage obligations
and pass-through securities .......................... 1,863 1,981
Total .......................................... $58,878 $60,658
Pre-refunded bonds of $6.06 billion and $7.56 billion at December 31, 2015 and 2014, respectively,
were bonds for which states or municipalities have established irrevocable trusts, almost exclusively
comprised of U.S. Treasury securities, which were created to satisfy their responsibility for payments of
principal and interest.
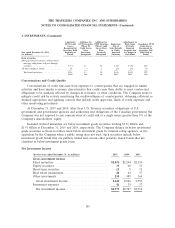
The Company’s fixed maturity investment portfolio at December 31, 2015 and 2014 included
$1.98 billion and $2.21 billion, respectively, of residential mortgage-backed securities, which include
pass-through securities and collateralized mortgage obligations (CMOs). Included in the totals at
December 31, 2015 and 2014 were $676 million and $872 million, respectively, of GNMA, FNMA,
FHLMC (excluding FHA project loans) and Canadian government guaranteed residential mortgage-
backed pass-through securities classified as available for sale. Also included in those totals were
residential CMOs classified as available for sale with a fair value of $1.30 billion and $1.34 billion at
December 31, 2015 and 2014, respectively. Approximately 48% and 46% of the Company’s CMO
holdings at December 31, 2015 and 2014, respectively, were guaranteed by or fully collateralized by
securities issued by GNMA, FNMA or FHLMC. The average credit rating of the $683 million and
$725 million of non-guaranteed CMO holdings at December 31, 2015 and 2014, respectively, was
‘‘Baa2’’ and ‘‘Ba1,’’ respectively. The average credit rating of all of the above securities was ‘‘Aa3’’ at
both December 31, 2015 and 2014.
At December 31, 2015 and 2014, the Company held commercial mortgage-backed securities
(CMBS, including FHA project loans) of $865 million and $715 million, respectively, which are
included in ‘‘All other corporate bonds’’ in the tables above. At December 31, 2015 and 2014,
approximately $303 million and $202 million of these securities, respectively, or the loans backing such
securities, contained guarantees by the U.S. government or a government-sponsored enterprise. The
average credit rating of the $562 million and $513 million of non-guaranteed securities at December 31,
2015 and 2014, respectively, was ‘‘Aaa’’ at both dates. The CMBS portfolio is supported by loans that
are diversified across economic sectors and geographical areas. The average credit rating of the CMBS
portfolio was ‘‘Aaa’’ at both December 31, 2015 and 2014.
At December 31, 2015 and 2014, the Company had $269 million and $296 million, respectively, of
securities on loan as part of a tri-party lending agreement.
189