Travelers 2015 Annual Report Download - page 203
Download and view the complete annual report
Please find page 203 of the 2015 Travelers annual report below. You can navigate through the pages in the report by either clicking on the pages listed below, or by using the keyword search tool below to find specific information within the annual report.-
 1
1 -
2
-
3
-
4
-
5
-
6
-
7
-
8
-
9
-
10
-
11
-
12
-
13
-
14
-
15
-
16
-
17
-
18
-
19
-
20
-
21
-
22
-
23
-
24
-
25
-
26
-
27
-
28
-
29
-
30
-
31
-
32
-
33
-
34
-
35
-
36
-
37
-
38
-
39
-
40
-
41
-
42
-
43
-
44
-
45
-
46
-
47
-
48
-
49
-
50
-
51
-
52
-
53
-
54
-
55
-
56
-
57
-
58
-
59
-
60
-
61
-
62
-
63
-
64
-
65
-
66
-
67
-
68
-
69
-
70
-
71
-
72
-
73
-
74
-
75
-
76
-
77
-
78
-
79
-
80
-
81
-
82
-
83
-
84
-
85
-
86
-
87
-
88
-
89
-
90
-
91
-
92
-
93
-
94
-
95
-
96
-
97
-
98
-
99
-
100
-
101
-
102
-
103
-
104
-
105
-
106
-
107
-
108
-
109
-
110
-
111
-
112
-
113
-
114
-
115
-
116
-
117
-
118
-
119
-
120
-
121
-
122
-
123
-
124
-
125
-
126
-
127
-
128
-
129
-
130
-
131
-
132
-
133
-
134
-
135
-
136
-
137
-
138
-
139
-
140
-
141
-
142
-
143
-
144
-
145
-
146
-
147
-
148
-
149
-
150
-
151
-
152
-
153
-
154
-
155
-
156
-
157
-
158
-
159
-
160
-
161
-
162
-
163
-
164
-
165
-
166
-
167
-
168
-
169
-
170
-
171
-
172
-
173
-
174
-
175
-
176
-
177
-
178
-
179
-
180
-
181
-
182
-
183
-
184
-
185
-
186
-
187
-
188
-
189
-
190
-
191
-
192
-
 193
193 -
 194
194 -
 195
195 -
 196
196 -
 197
197 -
 198
198 -
 199
199 -
 200
200 -
 201
201 -
 202
202 -
 203
203 -
 204
204 -
 205
205 -
 206
206 -
 207
207 -
 208
208 -
 209
209 -
 210
210 -
 211
211 -
 212
212 -
 213
213 -
214
-
215
-
216
-
217
-
218
-
219
-
220
-
221
-
222
-
223
-
224
-
225
-
226
-
227
-
228
-
229
-
230
-
231
-
232
-
233
-
234
-
235
-
236
-
237
-
238
-
239
-
240
-
241
-
242
-
243
-
244
-
245
-
246
-
247
-
248
-
249
-
250
-
251
-
252
-
253
-
254
-
255
-
256
-
257
-
258
-
259
-
260
-
261
-
262
-
263
-
264
-
265
-
266
-
267
-
268
-
269
-
270
-
271
-
272
-
273
-
274
-
275
-
276
-
277
-
278
-
279
-
280
-
281
-
282
-
283
-
284
-
285
-
286
-
287
 |
 |

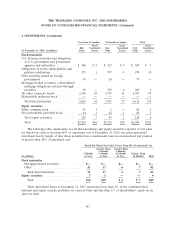
THE TRAVELERS COMPANIES, INC. AND SUBSIDIARIES
NOTES TO CONSOLIDATED FINANCIAL STATEMENTS (Continued)
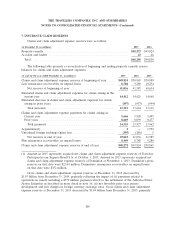
4. FAIR VALUE MEASUREMENTS (Continued)
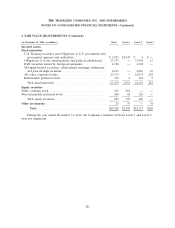
Financial Instruments Disclosed, But Not Carried, At Fair Value
The Company uses various financial instruments in the normal course of its business. The
Company’s insurance contracts are excluded from fair value of financial instruments accounting
guidance and, therefore, are not included in the amounts discussed below. The following tables present
the carrying value and fair value of the Company’s financial assets and financial liabilities disclosed, but
not carried, at fair value, and the level within the fair value hierarchy at which such assets and
liabilities are categorized.
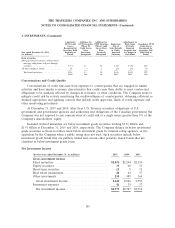
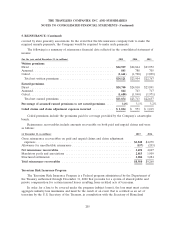
Carrying Fair
(at December 31, 2015, in millions) Value Value Level 1 Level 2 Level 3
Financial assets:
Short-term securities .............. $4,671 $4,671 $1,685 $2,958 $28
Financial liabilities:
Debt .......................... $6,244 $7,180 $ — $7,180 $—
Commercial paper ................ 100 100 — 100 —
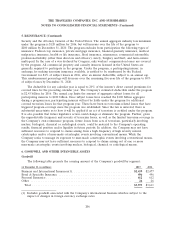
Carrying Fair
(at December 31, 2014, in millions) Value Value Level 1 Level 2 Level 3
Financial assets:
Short-term securities .............. $4,364 $4,364 $1,283 $3,042 $39
Financial liabilities:
Debt .......................... $6,249 $7,522 $ — $7,522 $—
Commercial paper ................ 100 100 — 100 —
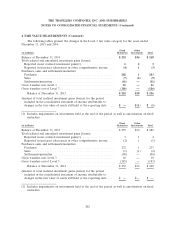
The Company utilized a pricing service to estimate fair value for approximately 99% and 98% of
short-term securities at December 31, 2015 and 2014, respectively. A description of the process and
inputs used by the pricing service to estimate fair value is discussed in the ‘‘Fixed Maturities’’ section
above. Estimates of fair value for U.S. Treasury securities and money market funds are based on
market quotations received from the pricing service and are disclosed in Level 1 of the hierarchy. The
fair value of other short-term fixed maturity securities is estimated by the pricing service using
observable market inputs and is disclosed in Level 2 of the hierarchy. For short-term securities where
an estimate is not obtained from the pricing service, the carrying value approximates fair value and is
included in Level 3 of the hierarchy.
The Company utilized a pricing service to estimate fair value for 100% of its debt, including
commercial paper, at December 31, 2015 and 2014. The pricing service utilizes market quotations for
debt that have quoted prices in active markets. Since fixed maturities other than U.S. Treasury
securities generally do not trade on a daily basis, the fair value estimates are based on market
observable inputs and disclosed in Level 2 of the hierarchy.
The Company had no material assets or liabilities that were measured at fair value on a
non-recurring basis during the years ended December 31, 2015 and 2014.
203