Travelers 2015 Annual Report Download - page 184
Download and view the complete annual report
Please find page 184 of the 2015 Travelers annual report below. You can navigate through the pages in the report by either clicking on the pages listed below, or by using the keyword search tool below to find specific information within the annual report.-
 1
1 -
2
-
3
-
4
-
5
-
6
-
7
-
8
-
9
-
10
-
11
-
12
-
13
-
14
-
15
-
16
-
17
-
18
-
19
-
20
-
21
-
22
-
23
-
24
-
25
-
26
-
27
-
28
-
29
-
30
-
31
-
32
-
33
-
34
-
35
-
36
-
37
-
38
-
39
-
40
-
41
-
42
-
43
-
44
-
45
-
46
-
47
-
48
-
49
-
50
-
51
-
52
-
53
-
54
-
55
-
56
-
57
-
58
-
59
-
60
-
61
-
62
-
63
-
64
-
65
-
66
-
67
-
68
-
69
-
70
-
71
-
72
-
73
-
74
-
75
-
76
-
77
-
78
-
79
-
80
-
81
-
82
-
83
-
84
-
85
-
86
-
87
-
88
-
89
-
90
-
91
-
92
-
93
-
94
-
95
-
96
-
97
-
98
-
99
-
100
-
101
-
102
-
103
-
104
-
105
-
106
-
107
-
108
-
109
-
110
-
111
-
112
-
113
-
114
-
115
-
116
-
117
-
118
-
119
-
120
-
121
-
122
-
123
-
124
-
125
-
126
-
127
-
128
-
129
-
130
-
131
-
132
-
133
-
134
-
135
-
136
-
137
-
138
-
139
-
140
-
141
-
142
-
143
-
144
-
145
-
146
-
147
-
148
-
149
-
150
-
151
-
152
-
153
-
154
-
155
-
156
-
157
-
158
-
159
-
160
-
161
-
162
-
163
-
164
-
165
-
166
-
167
-
168
-
169
-
170
-
171
-
172
-
173
-
 174
174 -
 175
175 -
 176
176 -
 177
177 -
 178
178 -
 179
179 -
 180
180 -
 181
181 -
 182
182 -
 183
183 -
 184
184 -
 185
185 -
 186
186 -
 187
187 -
 188
188 -
 189
189 -
 190
190 -
 191
191 -
 192
192 -
 193
193 -
 194
194 -
195
-
196
-
197
-
198
-
199
-
200
-
201
-
202
-
203
-
204
-
205
-
206
-
207
-
208
-
209
-
210
-
211
-
212
-
213
-
214
-
215
-
216
-
217
-
218
-
219
-
220
-
221
-
222
-
223
-
224
-
225
-
226
-
227
-
228
-
229
-
230
-
231
-
232
-
233
-
234
-
235
-
236
-
237
-
238
-
239
-
240
-
241
-
242
-
243
-
244
-
245
-
246
-
247
-
248
-
249
-
250
-
251
-
252
-
253
-
254
-
255
-
256
-
257
-
258
-
259
-
260
-
261
-
262
-
263
-
264
-
265
-
266
-
267
-
268
-
269
-
270
-
271
-
272
-
273
-
274
-
275
-
276
-
277
-
278
-
279
-
280
-
281
-
282
-
283
-
284
-
285
-
286
-
287
 |
 |

THE TRAVELERS COMPANIES, INC. AND SUBSIDIARIES
NOTES TO CONSOLIDATED FINANCIAL STATEMENTS (Continued)
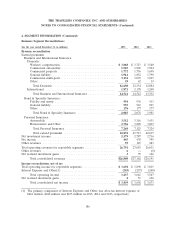
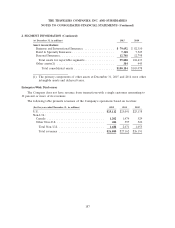
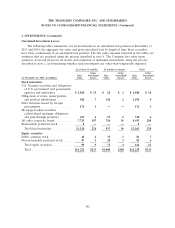
2. SEGMENT INFORMATION (Continued)
The following tables summarize the components of the Company’s operating revenues, operating
income, net written premiums and total assets by reportable business segments.
Business and Bond & Total
International Specialty Personal Reportable
(for the year ended December 31, in millions) Insurance Insurance Insurance Segments
2015
Premiums .................................... $14,521 $2,085 $7,268 $23,874
Net investment income ........................... 1,824 223 332 2,379
Fee income ................................... 445 — — 445
Other revenues ................................ 23 22 48 93
Total operating revenues(1) ...................... $16,813 $2,330 $7,648 $26,791
Amortization and depreciation ..................... $ 2,907 $ 467 $1,322 $ 4,696
Income tax expense ............................. 769 272 402 1,443
Operating income(1) ............................ 2,170 633 889 3,692
2014
Premiums .................................... $14,512 $2,076 $7,125 $23,713
Net investment income ........................... 2,156 252 379 2,787
Fee income ................................... 438 — — 438
Other revenues ................................ 46 19 80 145
Total operating revenues(1) ...................... $17,152 $2,347 $7,584 $27,083
Amortization and depreciation ..................... $ 2,909 $ 482 $1,347 $ 4,738
Income tax expense ............................. 798 348 366 1,512
Operating income(1) ............................ 2,347 727 824 3,898
2013
Premiums .................................... $13,332 $1,981 $7,324 $22,637
Net investment income ........................... 2,087 260 369 2,716
Fee income ................................... 395 — — 395
Other revenues ................................ 160 20 103 283
Total operating revenues(1) ...................... $15,974 $2,261 $7,796 $26,031
Amortization and depreciation ..................... $ 2,751 $ 473 $1,461 $ 4,685
Income tax expense ............................. 758 227 366 1,351
Operating income(1) ............................ 2,404 573 838 3,815
(1) Operating revenues for reportable business segments exclude net realized investment gains. Operating
income for reportable business segments equals net income excluding the after-tax impact of net
realized investment gains.
184