Travelers 2015 Annual Report Download - page 81
Download and view the complete annual report
Please find page 81 of the 2015 Travelers annual report below. You can navigate through the pages in the report by either clicking on the pages listed below, or by using the keyword search tool below to find specific information within the annual report.-
 1
1 -
2
-
3
-
4
-
5
-
6
-
7
-
8
-
9
-
10
-
11
-
12
-
13
-
14
-
15
-
16
-
17
-
18
-
19
-
20
-
21
-
22
-
23
-
24
-
25
-
26
-
27
-
28
-
29
-
30
-
31
-
32
-
33
-
34
-
35
-
36
-
37
-
38
-
39
-
40
-
41
-
42
-
43
-
44
-
45
-
46
-
47
-
48
-
49
-
50
-
51
-
52
-
53
-
54
-
55
-
56
-
57
-
58
-
59
-
60
-
61
-
62
-
63
-
64
-
65
-
66
-
67
-
68
-
69
-
70
-
 71
71 -
 72
72 -
 73
73 -
 74
74 -
 75
75 -
 76
76 -
 77
77 -
 78
78 -
 79
79 -
 80
80 -
 81
81 -
 82
82 -
 83
83 -
 84
84 -
 85
85 -
 86
86 -
 87
87 -
 88
88 -
 89
89 -
 90
90 -
 91
91 -
92
-
93
-
94
-
95
-
96
-
97
-
98
-
99
-
100
-
101
-
102
-
103
-
104
-
105
-
106
-
107
-
108
-
109
-
110
-
111
-
112
-
113
-
114
-
115
-
116
-
117
-
118
-
119
-
120
-
121
-
122
-
123
-
124
-
125
-
126
-
127
-
128
-
129
-
130
-
131
-
132
-
133
-
134
-
135
-
136
-
137
-
138
-
139
-
140
-
141
-
142
-
143
-
144
-
145
-
146
-
147
-
148
-
149
-
150
-
151
-
152
-
153
-
154
-
155
-
156
-
157
-
158
-
159
-
160
-
161
-
162
-
163
-
164
-
165
-
166
-
167
-
168
-
169
-
170
-
171
-
172
-
173
-
174
-
175
-
176
-
177
-
178
-
179
-
180
-
181
-
182
-
183
-
184
-
185
-
186
-
187
-
188
-
189
-
190
-
191
-
192
-
193
-
194
-
195
-
196
-
197
-
198
-
199
-
200
-
201
-
202
-
203
-
204
-
205
-
206
-
207
-
208
-
209
-
210
-
211
-
212
-
213
-
214
-
215
-
216
-
217
-
218
-
219
-
220
-
221
-
222
-
223
-
224
-
225
-
226
-
227
-
228
-
229
-
230
-
231
-
232
-
233
-
234
-
235
-
236
-
237
-
238
-
239
-
240
-
241
-
242
-
243
-
244
-
245
-
246
-
247
-
248
-
249
-
250
-
251
-
252
-
253
-
254
-
255
-
256
-
257
-
258
-
259
-
260
-
261
-
262
-
263
-
264
-
265
-
266
-
267
-
268
-
269
-
270
-
271
-
272
-
273
-
274
-
275
-
276
-
277
-
278
-
279
-
280
-
281
-
282
-
283
-
284
-
285
-
286
-
287
 |
 |

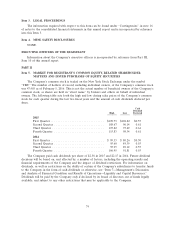
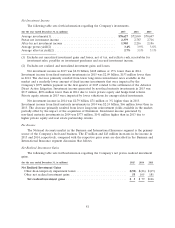
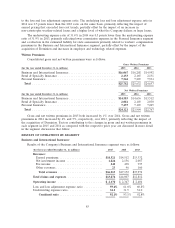
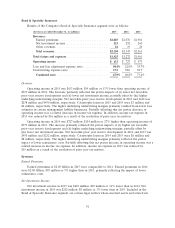
Net Investment Income
The following table sets forth information regarding the Company’s investments.
(for the year ended December 31, in millions) 2015 2014 2013
Average investments(1) ..................................... $70,627 $72,049 $70,697
Pretax net investment income ................................ 2,379 2,787 2,716
After-tax net investment income .............................. 1,905 2,216 2,186
Average pretax yield(2) .................................... 3.4% 3.9% 3.8%
Average after-tax yield(2) ................................... 2.7% 3.1% 3.1%
(1) Excludes net unrealized investment gains and losses, net of tax, and reflects cash, receivables for
investment sales, payables on investment purchases and accrued investment income.
(2) Excludes net realized and unrealized investment gains and losses.
Net investment income in 2015 was $2.38 billion, $408 million or 15% lower than in 2014.
Investment income from fixed maturity investments in 2015 was $2.09 billion, $153 million lower than
in 2014. The decrease primarily resulted from lower long-term reinvestment rates available in the
market and a modestly lower amount of fixed income investments that were impacted by the
Company’s $579 million payment in the first quarter of 2015 related to the settlement of the Asbestos
Direct Action Litigation. Investment income generated by non-fixed maturity investments in 2015 was
$317 million, $256 million lower than in 2014 due to lower private equity and hedge fund returns.
Private equity returns in 2015 were impacted by lower valuations for energy-related investments.
Net investment income in 2014 was $2.79 billion, $71 million or 3% higher than in 2013.
Investment income from fixed maturity investments in 2014 was $2.24 billion, $66 million lower than in
2013. The decrease primarily resulted from lower long-term reinvestment yields available in the market,
partially offset by the impact of the acquisition of Dominion. Investment income generated by
non-fixed maturity investments in 2014 was $573 million, $141 million higher than in 2013 due to
higher private equity and real estate partnership returns.
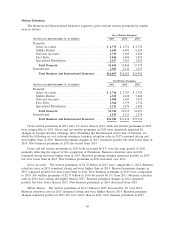
Fee Income
The National Accounts market in the Business and International Insurance segment is the primary
source of the Company’s fee-based business. The $7 million and $43 million increases in fee income in
2015 and 2014, respectively, compared with the respective prior years are described in the Business and
International Insurance segment discussion that follows.
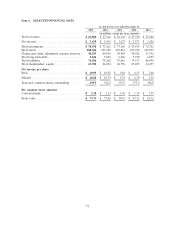
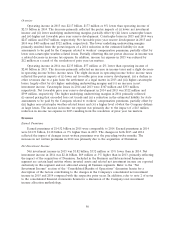
Net Realized Investment Gains
The following table sets forth information regarding the Company’s net pretax realized investment
gains.
(for the year ended December 31, in millions) 2015 2014 2013
Net Realized Investment Gains
Other-than-temporary impairment losses ............................. $(52) $(26) $(15)
Other net realized investment gains ................................ 55 105 181
Net realized investment gains ................................... $3 $ 79 $166
81