Travelers 2015 Annual Report Download - page 114
Download and view the complete annual report
Please find page 114 of the 2015 Travelers annual report below. You can navigate through the pages in the report by either clicking on the pages listed below, or by using the keyword search tool below to find specific information within the annual report.-
 1
1 -
2
-
3
-
4
-
5
-
6
-
7
-
8
-
9
-
10
-
11
-
12
-
13
-
14
-
15
-
16
-
17
-
18
-
19
-
20
-
21
-
22
-
23
-
24
-
25
-
26
-
27
-
28
-
29
-
30
-
31
-
32
-
33
-
34
-
35
-
36
-
37
-
38
-
39
-
40
-
41
-
42
-
43
-
44
-
45
-
46
-
47
-
48
-
49
-
50
-
51
-
52
-
53
-
54
-
55
-
56
-
57
-
58
-
59
-
60
-
61
-
62
-
63
-
64
-
65
-
66
-
67
-
68
-
69
-
70
-
71
-
72
-
73
-
74
-
75
-
76
-
77
-
78
-
79
-
80
-
81
-
82
-
83
-
84
-
85
-
86
-
87
-
88
-
89
-
90
-
91
-
92
-
93
-
94
-
95
-
96
-
97
-
98
-
99
-
100
-
101
-
102
-
103
-
 104
104 -
 105
105 -
 106
106 -
 107
107 -
 108
108 -
 109
109 -
 110
110 -
 111
111 -
 112
112 -
 113
113 -
 114
114 -
 115
115 -
 116
116 -
 117
117 -
 118
118 -
 119
119 -
 120
120 -
 121
121 -
 122
122 -
 123
123 -
 124
124 -
125
-
126
-
127
-
128
-
129
-
130
-
131
-
132
-
133
-
134
-
135
-
136
-
137
-
138
-
139
-
140
-
141
-
142
-
143
-
144
-
145
-
146
-
147
-
148
-
149
-
150
-
151
-
152
-
153
-
154
-
155
-
156
-
157
-
158
-
159
-
160
-
161
-
162
-
163
-
164
-
165
-
166
-
167
-
168
-
169
-
170
-
171
-
172
-
173
-
174
-
175
-
176
-
177
-
178
-
179
-
180
-
181
-
182
-
183
-
184
-
185
-
186
-
187
-
188
-
189
-
190
-
191
-
192
-
193
-
194
-
195
-
196
-
197
-
198
-
199
-
200
-
201
-
202
-
203
-
204
-
205
-
206
-
207
-
208
-
209
-
210
-
211
-
212
-
213
-
214
-
215
-
216
-
217
-
218
-
219
-
220
-
221
-
222
-
223
-
224
-
225
-
226
-
227
-
228
-
229
-
230
-
231
-
232
-
233
-
234
-
235
-
236
-
237
-
238
-
239
-
240
-
241
-
242
-
243
-
244
-
245
-
246
-
247
-
248
-
249
-
250
-
251
-
252
-
253
-
254
-
255
-
256
-
257
-
258
-
259
-
260
-
261
-
262
-
263
-
264
-
265
-
266
-
267
-
268
-
269
-
270
-
271
-
272
-
273
-
274
-
275
-
276
-
277
-
278
-
279
-
280
-
281
-
282
-
283
-
284
-
285
-
286
-
287
 |
 |

The Company actively monitors and evaluates changes in third-party models and, when necessary,
calibrates the catastrophe risk model estimates delivered via its own proprietary modeling processes.
The Company considers historical loss experience, recent events, underwriting practices, market share
analyses, external scientific analysis and various other factors to account for non-modeled losses to
refine its proprietary view of catastrophe risk. These proprietary models are continually updated as new
information emerges.
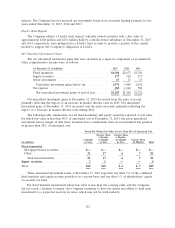
The tables below set forth the probabilities that estimated losses, comprising claims and allocated
claim adjustment expenses (but excluding unallocated claim adjustment expenses), from a single event
occurring in a one-year timeframe will equal or exceed the indicated loss amounts (expressed in dollars
and as a percentage of the Company’s common equity), based on the current version of the proprietary
and third-party computer models utilized by the Company at December 31, 2015. For example, on the
basis described below the tables, the Company estimates that there is a one percent chance that the
Company’s loss from a single U.S. hurricane in a one-year timeframe would equal or exceed
$1.2 billion, or 5% of the Company’s common equity at December 31, 2015.
Dollars (in billions)
Single U.S.
Single U.S. and Canadian
Likelihood of Exceedance(1) Hurricane Earthquake
2.0% (1-in-50) ................................. $1.0 $0.5
1.0% (1-in-100) ................................. $1.2 $0.6
0.4% (1-in-250) ................................. $1.8 $0.9
0.1% (1-in-1,000) ............................... $3.4 $1.5
Percentage of
Common Equity(2)
Single U.S.
Single U.S. and Canadian
Likelihood of Exceedance Hurricane Earthquake
2.0% (1-in-50) ................................. 4% 2%
1.0% (1-in-100) ................................. 5% 3%
0.4% (1-in-250) ................................. 8% 4%
0.1% (1-in-1,000) ............................... 15% 7%
(1) An event that has, for example, a 2% likelihood of exceedance is sometimes described as
a ‘‘1-in-50 year event.’’ As noted above, however, the probabilities in the table represent
the likelihood of losses from a single event equaling or exceeding the indicated threshold
loss amount in a one-year timeframe, not over a multi-year timeframe. Also, because the
probabilities relate to a single event, the probabilities do not address the likelihood of
more than one event occurring in a particular period, and, therefore, the amounts do not
address potential aggregate catastrophe losses occurring in a one-year timeframe.
(2) The percentage of common equity is calculated by dividing (a) indicated loss amounts in
dollars by (b) total common equity excluding net unrealized investment gains and losses,
net of taxes. Net unrealized investment gains and losses can be significantly impacted by
both discretionary and other economic factors and are not necessarily indicative of
operating trends. Accordingly, the Company’s management uses the percentage of
common equity calculated on this basis as a metric to evaluate the potential impact of a
single hurricane or single earthquake on the Company’s financial position for purposes of
making underwriting and reinsurance decisions.
The threshold loss amounts in the tables above, which are based on the Company’s in-force
portfolio at December 31, 2015 and catastrophe reinsurance program at January 1, 2016, are net of
reinsurance, after-tax and exclude unallocated claim adjustment expenses, which historically have been
114