Travelers 2015 Annual Report Download - page 111
Download and view the complete annual report
Please find page 111 of the 2015 Travelers annual report below. You can navigate through the pages in the report by either clicking on the pages listed below, or by using the keyword search tool below to find specific information within the annual report.-
 1
1 -
2
-
3
-
4
-
5
-
6
-
7
-
8
-
9
-
10
-
11
-
12
-
13
-
14
-
15
-
16
-
17
-
18
-
19
-
20
-
21
-
22
-
23
-
24
-
25
-
26
-
27
-
28
-
29
-
30
-
31
-
32
-
33
-
34
-
35
-
36
-
37
-
38
-
39
-
40
-
41
-
42
-
43
-
44
-
45
-
46
-
47
-
48
-
49
-
50
-
51
-
52
-
53
-
54
-
55
-
56
-
57
-
58
-
59
-
60
-
61
-
62
-
63
-
64
-
65
-
66
-
67
-
68
-
69
-
70
-
71
-
72
-
73
-
74
-
75
-
76
-
77
-
78
-
79
-
80
-
81
-
82
-
83
-
84
-
85
-
86
-
87
-
88
-
89
-
90
-
91
-
92
-
93
-
94
-
95
-
96
-
97
-
98
-
99
-
100
-
 101
101 -
 102
102 -
 103
103 -
 104
104 -
 105
105 -
 106
106 -
 107
107 -
 108
108 -
 109
109 -
 110
110 -
 111
111 -
 112
112 -
 113
113 -
 114
114 -
 115
115 -
 116
116 -
 117
117 -
 118
118 -
 119
119 -
 120
120 -
 121
121 -
122
-
123
-
124
-
125
-
126
-
127
-
128
-
129
-
130
-
131
-
132
-
133
-
134
-
135
-
136
-
137
-
138
-
139
-
140
-
141
-
142
-
143
-
144
-
145
-
146
-
147
-
148
-
149
-
150
-
151
-
152
-
153
-
154
-
155
-
156
-
157
-
158
-
159
-
160
-
161
-
162
-
163
-
164
-
165
-
166
-
167
-
168
-
169
-
170
-
171
-
172
-
173
-
174
-
175
-
176
-
177
-
178
-
179
-
180
-
181
-
182
-
183
-
184
-
185
-
186
-
187
-
188
-
189
-
190
-
191
-
192
-
193
-
194
-
195
-
196
-
197
-
198
-
199
-
200
-
201
-
202
-
203
-
204
-
205
-
206
-
207
-
208
-
209
-
210
-
211
-
212
-
213
-
214
-
215
-
216
-
217
-
218
-
219
-
220
-
221
-
222
-
223
-
224
-
225
-
226
-
227
-
228
-
229
-
230
-
231
-
232
-
233
-
234
-
235
-
236
-
237
-
238
-
239
-
240
-
241
-
242
-
243
-
244
-
245
-
246
-
247
-
248
-
249
-
250
-
251
-
252
-
253
-
254
-
255
-
256
-
257
-
258
-
259
-
260
-
261
-
262
-
263
-
264
-
265
-
266
-
267
-
268
-
269
-
270
-
271
-
272
-
273
-
274
-
275
-
276
-
277
-
278
-
279
-
280
-
281
-
282
-
283
-
284
-
285
-
286
-
287
 |
 |
from credit losses as those losses are initially allocated to subordinated bondholders. The Company’s
investment strategy is to purchase CMO tranches that are expected to offer the most favorable return
given the Company’s assessment of associated risks. The Company does not purchase residual interests
in CMOs. For more information regarding the Company’s investments in residential mortgage-backed
securities, see note 3 of notes to the consolidated financial statements herein.
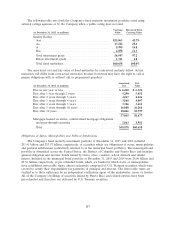
Alternative Documentation Mortgages and Sub-Prime Mortgages
At December 31, 2015 and 2014, the Company’s fixed maturity investment portfolio included
CMOs backed by alternative documentation mortgages and asset-backed securities collateralized by
sub-prime mortgages with a collective fair value of $185 million and $252 million, respectively
(comprising less than 1% of the Company’s total fixed maturity investments at both dates). The
Company defines sub-prime mortgage-backed securities as investments in which the underlying loans
primarily exhibit one or more of the following characteristics: low FICO scores, above-prime interest
rates, high loan-to-value ratios or high debt-to-income ratios. Alternative documentation securitizations
are those in which the underlying loans primarily meet the government-sponsored entities’ requirements
for credit score but do not meet the government-sponsored entities’ guidelines for documentation,
property type, debt and loan-to-value ratios. The average credit rating on these securities and
obligations held by the Company was’’Ba2’’ at both December 31, 2015 and 2014. The Company does
not believe this portfolio exposes it to a material adverse impact on its results of operations, financial
position or liquidity, due to the portfolio’s relatively small size.
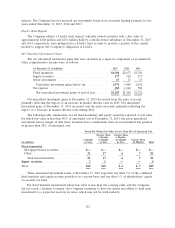
Commercial Mortgage-Backed Securities and Project Loans
At December 31, 2015 and 2014, the Company held commercial mortgage-backed securities
(including FHA project loans) of $865 million and $715 million, respectively. The Company does not
believe this portfolio exposes it to a material adverse impact on its results of operations, financial
position or liquidity, due to the portfolio’s relatively small size and the underlying credit strength of
these securities. For more information regarding the Company’s investments in commercial mortgage-
backed securities, see note 3 of notes to the consolidated financial statements herein.
Equity Securities Available for Sale, Real Estate and Short-Term Investments
See note 1 of notes to the consolidated financial statements herein for further information about
these invested asset classes.
Other Investments
The Company also invests in private equity limited partnerships, hedge funds, and real estate
partnerships. Also included in other investments are non-public common and preferred equities and
derivatives. These asset classes have historically provided a higher return than fixed maturities but are
subject to more volatility. At December 31, 2015 and 2014, the carrying value of the Company’s other
investments was $3.45 billion and $3.59 billion, respectively.
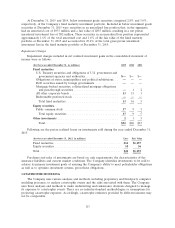
Securities Lending
The Company has engaged in securities lending activities from which it generates net investment
income by lending certain of its investments to other institutions for short periods of time. At
December 31, 2015 and 2014, the Company had $269 million and $296 million of securities on loan,
respectively, as part of a tri-party lending agreement. The average monthly balance of securities on loan
during 2015 and 2014 was $268 million and $228 million, respectively. Borrowers of these securities
provide collateral equal to at least 102% of the market value of the loaned securities plus accrued
111