Travelers 2015 Annual Report Download - page 91
Download and view the complete annual report
Please find page 91 of the 2015 Travelers annual report below. You can navigate through the pages in the report by either clicking on the pages listed below, or by using the keyword search tool below to find specific information within the annual report.-
 1
1 -
2
-
3
-
4
-
5
-
6
-
7
-
8
-
9
-
10
-
11
-
12
-
13
-
14
-
15
-
16
-
17
-
18
-
19
-
20
-
21
-
22
-
23
-
24
-
25
-
26
-
27
-
28
-
29
-
30
-
31
-
32
-
33
-
34
-
35
-
36
-
37
-
38
-
39
-
40
-
41
-
42
-
43
-
44
-
45
-
46
-
47
-
48
-
49
-
50
-
51
-
52
-
53
-
54
-
55
-
56
-
57
-
58
-
59
-
60
-
61
-
62
-
63
-
64
-
65
-
66
-
67
-
68
-
69
-
70
-
71
-
72
-
73
-
74
-
75
-
76
-
77
-
78
-
79
-
80
-
 81
81 -
 82
82 -
 83
83 -
 84
84 -
 85
85 -
 86
86 -
 87
87 -
 88
88 -
 89
89 -
 90
90 -
 91
91 -
 92
92 -
 93
93 -
 94
94 -
 95
95 -
 96
96 -
 97
97 -
 98
98 -
 99
99 -
 100
100 -
 101
101 -
102
-
103
-
104
-
105
-
106
-
107
-
108
-
109
-
110
-
111
-
112
-
113
-
114
-
115
-
116
-
117
-
118
-
119
-
120
-
121
-
122
-
123
-
124
-
125
-
126
-
127
-
128
-
129
-
130
-
131
-
132
-
133
-
134
-
135
-
136
-
137
-
138
-
139
-
140
-
141
-
142
-
143
-
144
-
145
-
146
-
147
-
148
-
149
-
150
-
151
-
152
-
153
-
154
-
155
-
156
-
157
-
158
-
159
-
160
-
161
-
162
-
163
-
164
-
165
-
166
-
167
-
168
-
169
-
170
-
171
-
172
-
173
-
174
-
175
-
176
-
177
-
178
-
179
-
180
-
181
-
182
-
183
-
184
-
185
-
186
-
187
-
188
-
189
-
190
-
191
-
192
-
193
-
194
-
195
-
196
-
197
-
198
-
199
-
200
-
201
-
202
-
203
-
204
-
205
-
206
-
207
-
208
-
209
-
210
-
211
-
212
-
213
-
214
-
215
-
216
-
217
-
218
-
219
-
220
-
221
-
222
-
223
-
224
-
225
-
226
-
227
-
228
-
229
-
230
-
231
-
232
-
233
-
234
-
235
-
236
-
237
-
238
-
239
-
240
-
241
-
242
-
243
-
244
-
245
-
246
-
247
-
248
-
249
-
250
-
251
-
252
-
253
-
254
-
255
-
256
-
257
-
258
-
259
-
260
-
261
-
262
-
263
-
264
-
265
-
266
-
267
-
268
-
269
-
270
-
271
-
272
-
273
-
274
-
275
-
276
-
277
-
278
-
279
-
280
-
281
-
282
-
283
-
284
-
285
-
286
-
287
 |
 |

Bond & Specialty Insurance
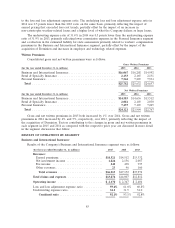
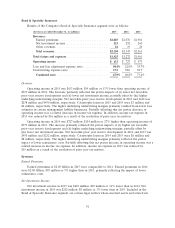
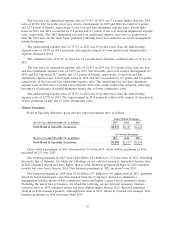
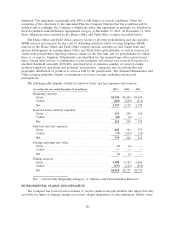
Results of the Company’s Bond & Specialty Insurance segment were as follows:
(for the year ended December 31, in millions) 2015 2014 2013
Revenues:
Earned premiums ........................... $2,085 $2,076 $1,981
Net investment income ........................ 223 252 260
Other revenues ............................. 22 19 20
Total revenues .............................. $2,330 $2,347 $2,261
Total claims and expenses ....................... $1,425 $1,272 $1,461
Operating income ............................. $ 633 $ 727 $ 573
Loss and loss adjustment expense ratio .............. 30.4% 22.8% 34.7%
Underwriting expense ratio ...................... 37.5 38.0 38.7
Combined ratio ............................. 67.9% 60.8% 73.4%
Overview
Operating income in 2015 was $633 million, $94 million or 13% lower than operating income of
$727 million in 2014. The decrease primarily reflected the pretax impacts of (i) lower net favorable
prior year reserve development and (ii) lower net investment income, partially offset by (iii) higher
underlying underwriting margins. Net favorable prior year reserve development in 2015 and 2014 was
$258 million and $450 million, respectively. Catastrophe losses in 2015 and 2014 were $3 million and
$6 million, respectively. The higher underlying underwriting margins primarily resulted from lower loss
estimates in certain management liability businesses. Partially offsetting this net pretax decrease in
operating income was a related decrease in income tax expense. In addition, income tax expense in
2015 was reduced by $16 million as a result of the resolution of prior year tax matters.
Operating income in 2014 was $727 million, $154 million or 27% higher than operating income of
$573 million in 2013. The increase primarily reflected the pretax impacts of (i) higher net favorable
prior year reserve development and (ii) higher underlying underwriting margins, partially offset by
(iii) lower net investment income. Net favorable prior year reserve development in 2014 and 2013 was
$450 million and $232 million, respectively. Catastrophe losses in 2014 and 2013 were $6 million and
$8 million, respectively. The higher underlying underwriting margins primarily reflected the pretax
impact of lower reinsurance costs. Partially offsetting this net pretax increase in operating income was a
related increase in income tax expense. In addition, income tax expense in 2013 was reduced by
$15 million as a result of the resolution of prior year tax matters.
Revenues
Earned Premiums
Earned premiums of $2.09 billion in 2015 were comparable to 2014. Earned premiums in 2014
were $2.08 billion, $95 million or 5% higher than in 2013, primarily reflecting the impact of lower
reinsurance costs.
Net Investment Income
Net investment income in 2015 was $223 million, $29 million or 12% lower than in 2014. Net
investment income in 2014 was $252 million, $8 million or 3% lower than in 2013. Included in the
Bond & Specialty Insurance segment are certain legal entities whose invested assets and related net
91