Travelers 2015 Annual Report Download - page 14
Download and view the complete annual report
Please find page 14 of the 2015 Travelers annual report below. You can navigate through the pages in the report by either clicking on the pages listed below, or by using the keyword search tool below to find specific information within the annual report.-
 1
1 -
2
-
3
-
 4
4 -
 5
5 -
 6
6 -
 7
7 -
 8
8 -
 9
9 -
 10
10 -
 11
11 -
 12
12 -
 13
13 -
 14
14 -
 15
15 -
 16
16 -
 17
17 -
 18
18 -
 19
19 -
 20
20 -
 21
21 -
 22
22 -
 23
23 -
 24
24 -
25
-
26
-
27
-
28
-
29
-
30
-
31
-
32
-
33
-
34
-
35
-
36
-
37
-
38
-
39
-
40
-
41
-
42
-
43
-
44
-
45
-
46
-
47
-
48
-
49
-
50
-
51
-
52
-
53
-
54
-
55
-
56
-
57
-
58
-
59
-
60
-
61
-
62
-
63
-
64
-
65
-
66
-
67
-
68
-
69
-
70
-
71
-
72
-
73
-
74
-
75
-
76
-
77
-
78
-
79
-
80
-
81
-
82
-
83
-
84
-
85
-
86
-
87
-
88
-
89
-
90
-
91
-
92
-
93
-
94
-
95
-
96
-
97
-
98
-
99
-
100
-
101
-
102
-
103
-
104
-
105
-
106
-
107
-
108
-
109
-
110
-
111
-
112
-
113
-
114
-
115
-
116
-
117
-
118
-
119
-
120
-
121
-
122
-
123
-
124
-
125
-
126
-
127
-
128
-
129
-
130
-
131
-
132
-
133
-
134
-
135
-
136
-
137
-
138
-
139
-
140
-
141
-
142
-
143
-
144
-
145
-
146
-
147
-
148
-
149
-
150
-
151
-
152
-
153
-
154
-
155
-
156
-
157
-
158
-
159
-
160
-
161
-
162
-
163
-
164
-
165
-
166
-
167
-
168
-
169
-
170
-
171
-
172
-
173
-
174
-
175
-
176
-
177
-
178
-
179
-
180
-
181
-
182
-
183
-
184
-
185
-
186
-
187
-
188
-
189
-
190
-
191
-
192
-
193
-
194
-
195
-
196
-
197
-
198
-
199
-
200
-
201
-
202
-
203
-
204
-
205
-
206
-
207
-
208
-
209
-
210
-
211
-
212
-
213
-
214
-
215
-
216
-
217
-
218
-
219
-
220
-
221
-
222
-
223
-
224
-
225
-
226
-
227
-
228
-
229
-
230
-
231
-
232
-
233
-
234
-
235
-
236
-
237
-
238
-
239
-
240
-
241
-
242
-
243
-
244
-
245
-
246
-
247
-
248
-
249
-
250
-
251
-
252
-
253
-
254
-
255
-
256
-
257
-
258
-
259
-
260
-
261
-
262
-
263
-
264
-
265
-
266
-
267
-
268
-
269
-
270
-
271
-
272
-
273
-
274
-
275
-
276
-
277
-
278
-
279
-
280
-
281
-
282
-
283
-
284
-
285
-
286
-
287
 |
 |

Product Lines
The Bond & Specialty Insurance segment writes the following types of coverages:
•Fidelity and Surety. Provides fidelity insurance coverage, which protects an insured for loss due
to embezzlement or misappropriation of funds by an employee, and surety, which is a three-
party agreement whereby the insurer agrees to pay a third party or make complete an obligation
in response to the default, acts or omissions of an insured. Surety is generally provided for
construction performance, legal matters such as appeals, trustees in bankruptcy and probate and
other performance bonds.
•General Liability. Provides coverage for specialized liability exposures as described above in
more detail in the ‘‘Business and International Insurance’’ section of this report, as well as cyber
risk coverages.
•Other. Coverages include Property, Workers’ Compensation, Commercial Automobile and
Commercial Multi-Peril, which are described above in more detail in the ‘‘Business and
International Insurance’’ section of this report.
Net Retention Policy Per Risk
The following discussion reflects the Company’s retention policy with respect to the Bond &
Specialty Insurance segment as of January 1, 2016. For third party liability, including but not limited to
umbrella liability, professional liability, directors’ and officers’ liability, employment practices liability
and cyber risk liability, Bond & Specialty Insurance generally limits net retentions to $25.0 million per
policy. For surety protection, where insured limits are often significant, Bond & Specialty Insurance
generally retains up to $115.0 million probable maximum loss (PML) per principal, after reinsurance,
but may retain higher amounts based on the type of obligation, credit quality and other credit risk
factors. Reinsurance treaties often have aggregate limits or caps which may result in larger net per risk
retentions if the aggregate limits or caps are reached. Bond & Specialty Insurance utilizes facultative
reinsurance to provide additional limits capacity or to reduce retentions on an individual risk basis.
Bond & Specialty Insurance may also retain amounts greater than those described herein based upon
the individual characteristics of the risk.
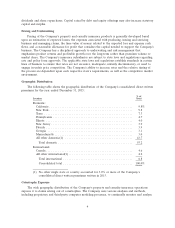
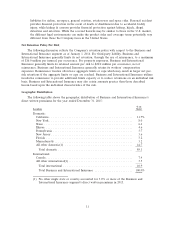
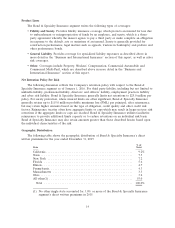
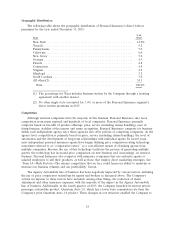
Geographic Distribution
The following table shows the geographic distribution of Bond & Specialty Insurance’s direct
written premiums for the year ended December 31, 2015:
% of
State Total
California .................................................. 9.2%
Texas ..................................................... 7.5
New York ................................................. 7.2
Florida ................................................... 5.6
Illinois .................................................... 4.7
Pennsylvania ................................................ 4.3
Massachusetts .............................................. 3.3
Ohio ..................................................... 3.2
All other(1) ................................................ 55.0
Total ................................................... 100.0%
(1) No other single state accounted for 3.0% or more of the Bond & Specialty Insurance
segment’s direct written premiums in 2015.
14