Travelers 2015 Annual Report Download - page 125
Download and view the complete annual report
Please find page 125 of the 2015 Travelers annual report below. You can navigate through the pages in the report by either clicking on the pages listed below, or by using the keyword search tool below to find specific information within the annual report.-
 1
1 -
2
-
3
-
4
-
5
-
6
-
7
-
8
-
9
-
10
-
11
-
12
-
13
-
14
-
15
-
16
-
17
-
18
-
19
-
20
-
21
-
22
-
23
-
24
-
25
-
26
-
27
-
28
-
29
-
30
-
31
-
32
-
33
-
34
-
35
-
36
-
37
-
38
-
39
-
40
-
41
-
42
-
43
-
44
-
45
-
46
-
47
-
48
-
49
-
50
-
51
-
52
-
53
-
54
-
55
-
56
-
57
-
58
-
59
-
60
-
61
-
62
-
63
-
64
-
65
-
66
-
67
-
68
-
69
-
70
-
71
-
72
-
73
-
74
-
75
-
76
-
77
-
78
-
79
-
80
-
81
-
82
-
83
-
84
-
85
-
86
-
87
-
88
-
89
-
90
-
91
-
92
-
93
-
94
-
95
-
96
-
97
-
98
-
99
-
100
-
101
-
102
-
103
-
104
-
105
-
106
-
107
-
108
-
109
-
110
-
111
-
112
-
113
-
114
-
 115
115 -
 116
116 -
 117
117 -
 118
118 -
 119
119 -
 120
120 -
 121
121 -
 122
122 -
 123
123 -
 124
124 -
 125
125 -
 126
126 -
 127
127 -
 128
128 -
 129
129 -
 130
130 -
 131
131 -
 132
132 -
 133
133 -
 134
134 -
 135
135 -
136
-
137
-
138
-
139
-
140
-
141
-
142
-
143
-
144
-
145
-
146
-
147
-
148
-
149
-
150
-
151
-
152
-
153
-
154
-
155
-
156
-
157
-
158
-
159
-
160
-
161
-
162
-
163
-
164
-
165
-
166
-
167
-
168
-
169
-
170
-
171
-
172
-
173
-
174
-
175
-
176
-
177
-
178
-
179
-
180
-
181
-
182
-
183
-
184
-
185
-
186
-
187
-
188
-
189
-
190
-
191
-
192
-
193
-
194
-
195
-
196
-
197
-
198
-
199
-
200
-
201
-
202
-
203
-
204
-
205
-
206
-
207
-
208
-
209
-
210
-
211
-
212
-
213
-
214
-
215
-
216
-
217
-
218
-
219
-
220
-
221
-
222
-
223
-
224
-
225
-
226
-
227
-
228
-
229
-
230
-
231
-
232
-
233
-
234
-
235
-
236
-
237
-
238
-
239
-
240
-
241
-
242
-
243
-
244
-
245
-
246
-
247
-
248
-
249
-
250
-
251
-
252
-
253
-
254
-
255
-
256
-
257
-
258
-
259
-
260
-
261
-
262
-
263
-
264
-
265
-
266
-
267
-
268
-
269
-
270
-
271
-
272
-
273
-
274
-
275
-
276
-
277
-
278
-
279
-
280
-
281
-
282
-
283
-
284
-
285
-
286
-
287
 |
 |

the Company’s qualified pension plan, capital requirements of the Company’s operating subsidiaries,
legal requirements, regulatory constraints, other investment opportunities (including mergers and
acquisitions and related financings), market conditions and other factors. In April 2015, the board of
directors approved a share repurchase authorization that added an additional $5.0 billion of repurchase
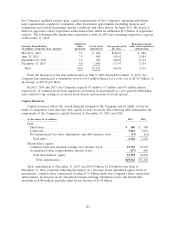
capacity. The following table summarizes repurchase activity in 2015 and remaining repurchase capacity
at December 31, 2015.
Number of Remaining capacity
Quarterly Period Ending shares Cost of shares Average price paid under share repurchase
(in millions, except per share amounts) purchased repurchased per share authorization
March 31, 2015 ................. 5.6 $ 600 $106.97 $ 884
June 30, 2015 .................. 7.9 800 101.62 5,084
September 30, 2015 .............. 7.3 750 102.81 4,334
December 31, 2015 .............. 8.8 1,000 113.47 3,334
Total ....................... 29.6 $3,150 106.46 3,334
From the inception of the first authorization on May 2, 2006 through December 31, 2015, the
Company has repurchased a cumulative total of 455.5 million shares for a total cost of $27.67 billion, or
an average of $60.74 per share.
In 2015, 2014 and 2013, the Company acquired 0.7 million, 0.7 million and 0.8 million shares,
respectively, of common stock from employees as treasury stock primarily to cover payroll withholding
taxes related to the vesting of restricted stock awards and exercises of stock options.
Capital Resources
Capital resources reflect the overall financial strength of the Company and its ability to borrow
funds at competitive rates and raise new capital to meet its needs. The following table summarizes the
components of the Company’s capital structure at December 31, 2015 and 2014.
(at December 31, in millions) 2015 2014
Debt:
Short-term ............................................. $ 500 $ 500
Long-term ............................................. 5,861 5,861
Net unamortized fair value adjustments and debt issuance costs ...... (17) (12)
Total debt ............................................ 6,344 6,349
Shareholders’ equity:
Common stock and retained earnings, less treasury stock ........... 23,755 23,956
Accumulated other comprehensive income (loss) ................. (157) 880
Total shareholders’ equity ................................ 23,598 24,836
Total capitalization .................................... $29,942 $31,185
Total capitalization at December 31, 2015 was $29.94 billion, $1.24 billion lower than at
December 31, 2014, primarily reflecting the impact of a decrease in net unrealized appreciation of
investments, common share repurchases totaling $3.15 billion under the Company’s share repurchase
authorization, an increase in net unrealized foreign exchange translation losses and shareholder
dividends of $744 million, partially offset by net income of $3.44 billion.
125