Travelers 2015 Annual Report Download - page 163
Download and view the complete annual report
Please find page 163 of the 2015 Travelers annual report below. You can navigate through the pages in the report by either clicking on the pages listed below, or by using the keyword search tool below to find specific information within the annual report.-
 1
1 -
2
-
3
-
4
-
5
-
6
-
7
-
8
-
9
-
10
-
11
-
12
-
13
-
14
-
15
-
16
-
17
-
18
-
19
-
20
-
21
-
22
-
23
-
24
-
25
-
26
-
27
-
28
-
29
-
30
-
31
-
32
-
33
-
34
-
35
-
36
-
37
-
38
-
39
-
40
-
41
-
42
-
43
-
44
-
45
-
46
-
47
-
48
-
49
-
50
-
51
-
52
-
53
-
54
-
55
-
56
-
57
-
58
-
59
-
60
-
61
-
62
-
63
-
64
-
65
-
66
-
67
-
68
-
69
-
70
-
71
-
72
-
73
-
74
-
75
-
76
-
77
-
78
-
79
-
80
-
81
-
82
-
83
-
84
-
85
-
86
-
87
-
88
-
89
-
90
-
91
-
92
-
93
-
94
-
95
-
96
-
97
-
98
-
99
-
100
-
101
-
102
-
103
-
104
-
105
-
106
-
107
-
108
-
109
-
110
-
111
-
112
-
113
-
114
-
115
-
116
-
117
-
118
-
119
-
120
-
121
-
122
-
123
-
124
-
125
-
126
-
127
-
128
-
129
-
130
-
131
-
132
-
133
-
134
-
135
-
136
-
137
-
138
-
139
-
140
-
141
-
142
-
143
-
144
-
145
-
146
-
147
-
148
-
149
-
150
-
151
-
152
-
 153
153 -
 154
154 -
 155
155 -
 156
156 -
 157
157 -
 158
158 -
 159
159 -
 160
160 -
 161
161 -
 162
162 -
 163
163 -
 164
164 -
 165
165 -
 166
166 -
 167
167 -
 168
168 -
 169
169 -
 170
170 -
 171
171 -
 172
172 -
 173
173 -
174
-
175
-
176
-
177
-
178
-
179
-
180
-
181
-
182
-
183
-
184
-
185
-
186
-
187
-
188
-
189
-
190
-
191
-
192
-
193
-
194
-
195
-
196
-
197
-
198
-
199
-
200
-
201
-
202
-
203
-
204
-
205
-
206
-
207
-
208
-
209
-
210
-
211
-
212
-
213
-
214
-
215
-
216
-
217
-
218
-
219
-
220
-
221
-
222
-
223
-
224
-
225
-
226
-
227
-
228
-
229
-
230
-
231
-
232
-
233
-
234
-
235
-
236
-
237
-
238
-
239
-
240
-
241
-
242
-
243
-
244
-
245
-
246
-
247
-
248
-
249
-
250
-
251
-
252
-
253
-
254
-
255
-
256
-
257
-
258
-
259
-
260
-
261
-
262
-
263
-
264
-
265
-
266
-
267
-
268
-
269
-
270
-
271
-
272
-
273
-
274
-
275
-
276
-
277
-
278
-
279
-
280
-
281
-
282
-
283
-
284
-
285
-
286
-
287
 |
 |

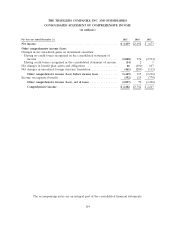
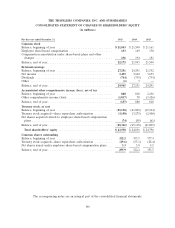
THE TRAVELERS COMPANIES, INC. AND SUBSIDIARIES
CONSOLIDATED STATEMENT OF INCOME
(in millions, except per share amounts)
For the year ended December 31, 2015 2014 2013
Revenues
Premiums .............................................. $23,874 $23,713 $22,637
Net investment income ..................................... 2,379 2,787 2,716
Fee income ............................................. 445 438 395
Net realized investment gains(1) .............................. 379 166
Other revenues .......................................... 99 145 277
Total revenues ........................................ 26,800 27,162 26,191
Claims and expenses
Claims and claim adjustment expenses .......................... 13,723 13,870 13,307
Amortization of deferred acquisition costs ....................... 3,885 3,882 3,821
General and administrative expenses ........................... 4,079 3,952 3,757
Interest expense .......................................... 373 369 361
Total claims and expenses ............................... 22,060 22,073 21,246
Income before income taxes ................................ 4,740 5,089 4,945
Income tax expense ....................................... 1,301 1,397 1,272
Net income ............................................ $ 3,439 $ 3,692 $ 3,673
Net income per share
Basic ................................................ $ 10.99 $ 10.82 $ 9.84
Diluted .............................................. $ 10.88 $ 10.70 $ 9.74
Weighted average number of common shares outstanding
Basic ................................................ 310.6 338.8 370.3
Diluted .............................................. 313.9 342.5 374.3
Cash dividends declared per common share ..................... $ 2.38 $ 2.15 $ 1.96
(1) Total other-than-temporary impairment (OTTI) losses were $(54) million, $(22) million and
$(10) million for the years ended December 31, 2015, 2014 and 2013, respectively. Of total OTTI,
credit losses of $(52) million, $(26) million and $(15) million for the years ended December 31,
2015, 2014 and 2013, respectively, were recognized in net realized investment gains. In addition,
unrealized gains (losses) from other changes in total OTTI of $(2) million, $4 million and
$5 million for the years ended December 31, 2015, 2014 and 2013, respectively, were recognized in
other comprehensive income (loss) as part of changes in net unrealized gains on investment
securities having credit losses recognized in the consolidated statement of income.
The accompanying notes are an integral part of the consolidated financial statements.
163