Travelers 2015 Annual Report Download - page 239
Download and view the complete annual report
Please find page 239 of the 2015 Travelers annual report below. You can navigate through the pages in the report by either clicking on the pages listed below, or by using the keyword search tool below to find specific information within the annual report.-
 1
1 -
2
-
3
-
4
-
5
-
6
-
7
-
8
-
9
-
10
-
11
-
12
-
13
-
14
-
15
-
16
-
17
-
18
-
19
-
20
-
21
-
22
-
23
-
24
-
25
-
26
-
27
-
28
-
29
-
30
-
31
-
32
-
33
-
34
-
35
-
36
-
37
-
38
-
39
-
40
-
41
-
42
-
43
-
44
-
45
-
46
-
47
-
48
-
49
-
50
-
51
-
52
-
53
-
54
-
55
-
56
-
57
-
58
-
59
-
60
-
61
-
62
-
63
-
64
-
65
-
66
-
67
-
68
-
69
-
70
-
71
-
72
-
73
-
74
-
75
-
76
-
77
-
78
-
79
-
80
-
81
-
82
-
83
-
84
-
85
-
86
-
87
-
88
-
89
-
90
-
91
-
92
-
93
-
94
-
95
-
96
-
97
-
98
-
99
-
100
-
101
-
102
-
103
-
104
-
105
-
106
-
107
-
108
-
109
-
110
-
111
-
112
-
113
-
114
-
115
-
116
-
117
-
118
-
119
-
120
-
121
-
122
-
123
-
124
-
125
-
126
-
127
-
128
-
129
-
130
-
131
-
132
-
133
-
134
-
135
-
136
-
137
-
138
-
139
-
140
-
141
-
142
-
143
-
144
-
145
-
146
-
147
-
148
-
149
-
150
-
151
-
152
-
153
-
154
-
155
-
156
-
157
-
158
-
159
-
160
-
161
-
162
-
163
-
164
-
165
-
166
-
167
-
168
-
169
-
170
-
171
-
172
-
173
-
174
-
175
-
176
-
177
-
178
-
179
-
180
-
181
-
182
-
183
-
184
-
185
-
186
-
187
-
188
-
189
-
190
-
191
-
192
-
193
-
194
-
195
-
196
-
197
-
198
-
199
-
200
-
201
-
202
-
203
-
204
-
205
-
206
-
207
-
208
-
209
-
210
-
211
-
212
-
213
-
214
-
215
-
216
-
217
-
218
-
219
-
220
-
221
-
222
-
223
-
224
-
225
-
226
-
227
-
228
-
 229
229 -
 230
230 -
 231
231 -
 232
232 -
 233
233 -
 234
234 -
 235
235 -
 236
236 -
 237
237 -
 238
238 -
 239
239 -
 240
240 -
 241
241 -
 242
242 -
 243
243 -
 244
244 -
 245
245 -
 246
246 -
 247
247 -
 248
248 -
 249
249 -
250
-
251
-
252
-
253
-
254
-
255
-
256
-
257
-
258
-
259
-
260
-
261
-
262
-
263
-
264
-
265
-
266
-
267
-
268
-
269
-
270
-
271
-
272
-
273
-
274
-
275
-
276
-
277
-
278
-
279
-
280
-
281
-
282
-
283
-
284
-
285
-
286
-
287
 |
 |

THE TRAVELERS COMPANIES, INC. AND SUBSIDIARIES
NOTES TO CONSOLIDATED FINANCIAL STATEMENTS (Continued)
14. PENSION PLANS, RETIREMENT BENEFITS AND SAVINGS PLANS (Continued)
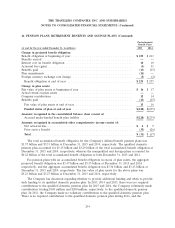
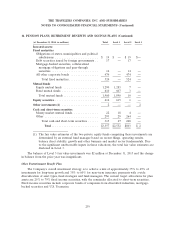
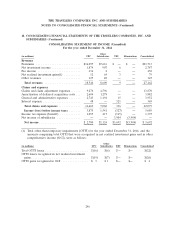
(at December 31, 2014, in millions) Total Level 1 Level 2 Level 3
Invested assets:
Fixed maturities
Obligations of states, municipalities and political
subdivisions ......................... $ 19 $ — $ 19 $—
Debt securities issued by foreign governments . . 17 — 17 —
Mortgage-backed securities, collateralized
mortgage obligations and pass-through
securities ........................... 14 — 14 —
All other corporate bonds ................ 474 — 474 —
Total fixed maturities ................. 524 — 524 —
Mutual funds
Equity mutual funds .................... 1,290 1,283 7 —
Bond mutual funds ..................... 610 607 3 —
Total mutual funds .................... 1,900 1,890 10 —
Equity securities ......................... 616 615 1 —
Other investments(1) ..................... 2 — — 2
Cash and short-term securities
Money market mutual funds ............... 22 18 4 —
Other ............................... 293 29 264 —
Total cash and short-term securities ...... 315 47 268 —
Total ........................... $3,357 $2,552 $803 $ 2
(1) The fair value estimates of the two private equity funds comprising these investments are
determined by an external fund manager based on recent filings, operating results,
balance sheet stability, growth and other business and market sector fundamentals. Due
to the significant unobservable inputs in these valuations, the total fair value estimates are
disclosed in Level 3.
The balance of Level 3 fair value investments was $2 million at December 31, 2015 and the change
in balance from the prior year was insignificant.
Other Postretirement Benefit Plan
The Company’s overall investment strategy is to achieve a mix of approximately 35% to 65% of
investments for long-term growth and 35% to 60% for near-term insurance payments with a wide
diversification of asset types, fund strategies and fund managers. The current target allocations for plan
assets are 25% to 75% fixed income securities, with the remainder allocated to short-term securities.
Fixed income securities include corporate bonds of companies from diversified industries, mortgage-
backed securities and U.S. Treasuries.
239