Travelers 2015 Annual Report Download - page 113
Download and view the complete annual report
Please find page 113 of the 2015 Travelers annual report below. You can navigate through the pages in the report by either clicking on the pages listed below, or by using the keyword search tool below to find specific information within the annual report.-
 1
1 -
2
-
3
-
4
-
5
-
6
-
7
-
8
-
9
-
10
-
11
-
12
-
13
-
14
-
15
-
16
-
17
-
18
-
19
-
20
-
21
-
22
-
23
-
24
-
25
-
26
-
27
-
28
-
29
-
30
-
31
-
32
-
33
-
34
-
35
-
36
-
37
-
38
-
39
-
40
-
41
-
42
-
43
-
44
-
45
-
46
-
47
-
48
-
49
-
50
-
51
-
52
-
53
-
54
-
55
-
56
-
57
-
58
-
59
-
60
-
61
-
62
-
63
-
64
-
65
-
66
-
67
-
68
-
69
-
70
-
71
-
72
-
73
-
74
-
75
-
76
-
77
-
78
-
79
-
80
-
81
-
82
-
83
-
84
-
85
-
86
-
87
-
88
-
89
-
90
-
91
-
92
-
93
-
94
-
95
-
96
-
97
-
98
-
99
-
100
-
101
-
102
-
 103
103 -
 104
104 -
 105
105 -
 106
106 -
 107
107 -
 108
108 -
 109
109 -
 110
110 -
 111
111 -
 112
112 -
 113
113 -
 114
114 -
 115
115 -
 116
116 -
 117
117 -
 118
118 -
 119
119 -
 120
120 -
 121
121 -
 122
122 -
 123
123 -
124
-
125
-
126
-
127
-
128
-
129
-
130
-
131
-
132
-
133
-
134
-
135
-
136
-
137
-
138
-
139
-
140
-
141
-
142
-
143
-
144
-
145
-
146
-
147
-
148
-
149
-
150
-
151
-
152
-
153
-
154
-
155
-
156
-
157
-
158
-
159
-
160
-
161
-
162
-
163
-
164
-
165
-
166
-
167
-
168
-
169
-
170
-
171
-
172
-
173
-
174
-
175
-
176
-
177
-
178
-
179
-
180
-
181
-
182
-
183
-
184
-
185
-
186
-
187
-
188
-
189
-
190
-
191
-
192
-
193
-
194
-
195
-
196
-
197
-
198
-
199
-
200
-
201
-
202
-
203
-
204
-
205
-
206
-
207
-
208
-
209
-
210
-
211
-
212
-
213
-
214
-
215
-
216
-
217
-
218
-
219
-
220
-
221
-
222
-
223
-
224
-
225
-
226
-
227
-
228
-
229
-
230
-
231
-
232
-
233
-
234
-
235
-
236
-
237
-
238
-
239
-
240
-
241
-
242
-
243
-
244
-
245
-
246
-
247
-
248
-
249
-
250
-
251
-
252
-
253
-
254
-
255
-
256
-
257
-
258
-
259
-
260
-
261
-
262
-
263
-
264
-
265
-
266
-
267
-
268
-
269
-
270
-
271
-
272
-
273
-
274
-
275
-
276
-
277
-
278
-
279
-
280
-
281
-
282
-
283
-
284
-
285
-
286
-
287
 |
 |

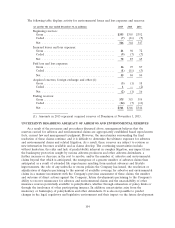
At December 31, 2015 and 2014, below investment grade securities comprised 2.8% and 3.0%,
respectively, of the Company’s fixed maturity investment portfolio. Included in below investment grade
securities at December 31, 2015 were securities in an unrealized loss position that, in the aggregate,
had an amortized cost of $937 million and a fair value of $855 million, resulting in a net pretax
unrealized investment loss of $82 million. These securities in an unrealized loss position represented
approximately 1.6% of the total amortized cost and 1.4% of the fair value of the fixed maturity
portfolio at December 31, 2015 and accounted for 25.6% of the total gross pretax unrealized
investment loss in the fixed maturity portfolio at December 31, 2015.
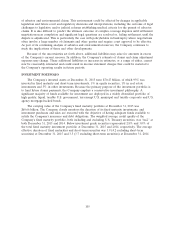
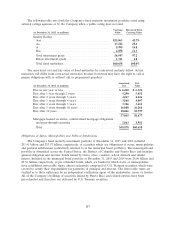
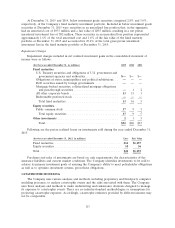
Impairment Charges
Impairment charges included in net realized investment gains in the consolidated statement of
income were as follows:
(for the year ended December 31, in millions) 2015 2014 2013
Fixed maturities
U.S. Treasury securities and obligations of U.S. government and
government agencies and authorities ................... $— $— $—
Obligations of states, municipalities and political subdivisions . . ———
Debt securities issued by foreign governments ............. ———
Mortgage-backed securities, collateralized mortgage obligations
and pass-through securities ......................... —12
All other corporate bonds ............................ 13 15 3
Redeemable preferred stock .......................... ———
Total fixed maturities .............................. 13 16 5
Equity securities
Public common stock ............................... 37 95
Total equity securities ............................. 37 95
Other investments ................................... 215
Total .......................................... $52 $26 $15
Following are the pretax realized losses on investments sold during the year ended December 31,
2015:
(for the year ended December 31, 2015, in millions) Loss Fair Value
Fixed maturities ...................................... $14 $1,157
Equity securities ...................................... 10 36
Total .............................................. $24 $1,193
Purchases and sales of investments are based on cash requirements, the characteristics of the
insurance liabilities and current market conditions. The Company identifies investments to be sold to
achieve its primary investment goals of assuring the Company’s ability to meet policyholder obligations
as well as to optimize investment returns, given these obligations.
CATASTROPHE MODELING
The Company uses various analyses and methods, including proprietary and third-party computer
modeling processes, to analyze catastrophic events and the risks associated with them. The Company
uses these analyses and methods to make underwriting and reinsurance decisions designed to manage
its exposure to catastrophic events. There are no industry-standard methodologies or assumptions for
projecting catastrophe exposure. Accordingly, catastrophe estimates provided by different insurers may
not be comparable.
113