Travelers 2015 Annual Report Download - page 193
Download and view the complete annual report
Please find page 193 of the 2015 Travelers annual report below. You can navigate through the pages in the report by either clicking on the pages listed below, or by using the keyword search tool below to find specific information within the annual report.-
 1
1 -
2
-
3
-
4
-
5
-
6
-
7
-
8
-
9
-
10
-
11
-
12
-
13
-
14
-
15
-
16
-
17
-
18
-
19
-
20
-
21
-
22
-
23
-
24
-
25
-
26
-
27
-
28
-
29
-
30
-
31
-
32
-
33
-
34
-
35
-
36
-
37
-
38
-
39
-
40
-
41
-
42
-
43
-
44
-
45
-
46
-
47
-
48
-
49
-
50
-
51
-
52
-
53
-
54
-
55
-
56
-
57
-
58
-
59
-
60
-
61
-
62
-
63
-
64
-
65
-
66
-
67
-
68
-
69
-
70
-
71
-
72
-
73
-
74
-
75
-
76
-
77
-
78
-
79
-
80
-
81
-
82
-
83
-
84
-
85
-
86
-
87
-
88
-
89
-
90
-
91
-
92
-
93
-
94
-
95
-
96
-
97
-
98
-
99
-
100
-
101
-
102
-
103
-
104
-
105
-
106
-
107
-
108
-
109
-
110
-
111
-
112
-
113
-
114
-
115
-
116
-
117
-
118
-
119
-
120
-
121
-
122
-
123
-
124
-
125
-
126
-
127
-
128
-
129
-
130
-
131
-
132
-
133
-
134
-
135
-
136
-
137
-
138
-
139
-
140
-
141
-
142
-
143
-
144
-
145
-
146
-
147
-
148
-
149
-
150
-
151
-
152
-
153
-
154
-
155
-
156
-
157
-
158
-
159
-
160
-
161
-
162
-
163
-
164
-
165
-
166
-
167
-
168
-
169
-
170
-
171
-
172
-
173
-
174
-
175
-
176
-
177
-
178
-
179
-
180
-
181
-
182
-
 183
183 -
 184
184 -
 185
185 -
 186
186 -
 187
187 -
 188
188 -
 189
189 -
 190
190 -
 191
191 -
 192
192 -
 193
193 -
 194
194 -
 195
195 -
 196
196 -
 197
197 -
 198
198 -
 199
199 -
 200
200 -
 201
201 -
 202
202 -
 203
203 -
204
-
205
-
206
-
207
-
208
-
209
-
210
-
211
-
212
-
213
-
214
-
215
-
216
-
217
-
218
-
219
-
220
-
221
-
222
-
223
-
224
-
225
-
226
-
227
-
228
-
229
-
230
-
231
-
232
-
233
-
234
-
235
-
236
-
237
-
238
-
239
-
240
-
241
-
242
-
243
-
244
-
245
-
246
-
247
-
248
-
249
-
250
-
251
-
252
-
253
-
254
-
255
-
256
-
257
-
258
-
259
-
260
-
261
-
262
-
263
-
264
-
265
-
266
-
267
-
268
-
269
-
270
-
271
-
272
-
273
-
274
-
275
-
276
-
277
-
278
-
279
-
280
-
281
-
282
-
283
-
284
-
285
-
286
-
287
 |
 |

THE TRAVELERS COMPANIES, INC. AND SUBSIDIARIES
NOTES TO CONSOLIDATED FINANCIAL STATEMENTS (Continued)
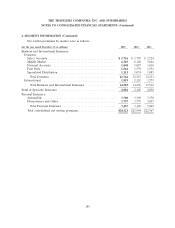
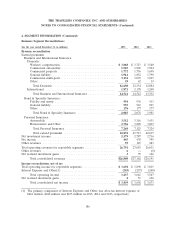
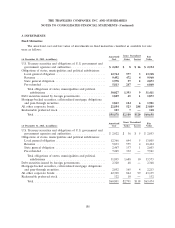
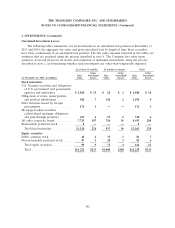
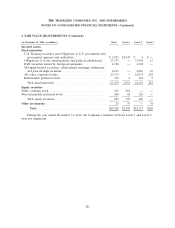
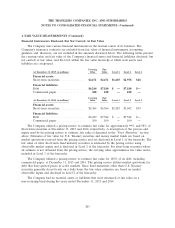
3. INVESTMENTS (Continued)
Less than 12 months 12 months or longer Total
Gross Gross Gross
Fair Unrealized Fair Unrealized Fair Unrealized
(at December 31, 2014, in millions) Value Losses Value Losses Value Losses
Fixed maturities
U.S. Treasury securities and obligations
of U.S. government and government
agencies and authorities ........... $ 180 $ 2 $ 125 $ 3 $ 305 $ 5
Obligations of states, municipalities and
political subdivisions .............. 173 1 797 9 970 10
Debt securities issued by foreign
governments ................... 50 — 24 — 74 —
Mortgage-backed securities, collateralized
mortgage obligations and pass-through
securities ...................... 68 — 192 4 260 4
All other corporate bonds ........... 2,148 38 2,355 61 4,503 99
Redeemable preferred stock .......... — — — — — —
Total fixed maturities ............. 2,619 41 3,493 77 6,112 118
Equity securities
Public common stock ............... 81 4 1 — 82 4
Non-redeemable preferred stock ....... 44 1 42 1 86 2
Total equity securities ............. 125 5 43 1 168 6
Total ......................... $2,744 $46 $3,536 $78 $6,280 $124
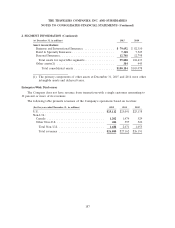
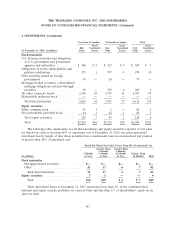
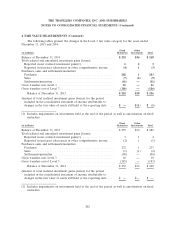
The following table summarizes, for all fixed maturities and equity securities reported at fair value
for which fair value is less than 80% of amortized cost at December 31, 2015, the gross unrealized
investment loss by length of time those securities have continuously been in an unrealized loss position
of greater than 20% of amortized cost:
Period For Which Fair Value Is Less Than 80% of Amortized Cost
Greater Than Greater Than
3 Months, 6 Months,
3 Months 6 Months 12 Months Greater Than
(in millions) or Less or Less or Less 12 Months Total
Fixed maturities
Mortgage-backed securities ............ $— $— $— $— $—
Other ........................... 51 17 6 7 81
Total fixed maturities ............... 51 17 6 7 81
Equity securities ..................... 31——4
Total .......................... $54 $18 $ 6 $ 7 $85
These unrealized losses at December 31, 2015 represented less than 1% of the combined fixed
maturity and equity security portfolios on a pretax basis and less than 1% of shareholders’ equity on an
after-tax basis.
193