Travelers 2015 Annual Report Download - page 18
Download and view the complete annual report
Please find page 18 of the 2015 Travelers annual report below. You can navigate through the pages in the report by either clicking on the pages listed below, or by using the keyword search tool below to find specific information within the annual report.-
 1
1 -
2
-
3
-
4
-
5
-
6
-
7
-
 8
8 -
 9
9 -
 10
10 -
 11
11 -
 12
12 -
 13
13 -
 14
14 -
 15
15 -
 16
16 -
 17
17 -
 18
18 -
 19
19 -
 20
20 -
 21
21 -
 22
22 -
 23
23 -
 24
24 -
 25
25 -
 26
26 -
 27
27 -
 28
28 -
29
-
30
-
31
-
32
-
33
-
34
-
35
-
36
-
37
-
38
-
39
-
40
-
41
-
42
-
43
-
44
-
45
-
46
-
47
-
48
-
49
-
50
-
51
-
52
-
53
-
54
-
55
-
56
-
57
-
58
-
59
-
60
-
61
-
62
-
63
-
64
-
65
-
66
-
67
-
68
-
69
-
70
-
71
-
72
-
73
-
74
-
75
-
76
-
77
-
78
-
79
-
80
-
81
-
82
-
83
-
84
-
85
-
86
-
87
-
88
-
89
-
90
-
91
-
92
-
93
-
94
-
95
-
96
-
97
-
98
-
99
-
100
-
101
-
102
-
103
-
104
-
105
-
106
-
107
-
108
-
109
-
110
-
111
-
112
-
113
-
114
-
115
-
116
-
117
-
118
-
119
-
120
-
121
-
122
-
123
-
124
-
125
-
126
-
127
-
128
-
129
-
130
-
131
-
132
-
133
-
134
-
135
-
136
-
137
-
138
-
139
-
140
-
141
-
142
-
143
-
144
-
145
-
146
-
147
-
148
-
149
-
150
-
151
-
152
-
153
-
154
-
155
-
156
-
157
-
158
-
159
-
160
-
161
-
162
-
163
-
164
-
165
-
166
-
167
-
168
-
169
-
170
-
171
-
172
-
173
-
174
-
175
-
176
-
177
-
178
-
179
-
180
-
181
-
182
-
183
-
184
-
185
-
186
-
187
-
188
-
189
-
190
-
191
-
192
-
193
-
194
-
195
-
196
-
197
-
198
-
199
-
200
-
201
-
202
-
203
-
204
-
205
-
206
-
207
-
208
-
209
-
210
-
211
-
212
-
213
-
214
-
215
-
216
-
217
-
218
-
219
-
220
-
221
-
222
-
223
-
224
-
225
-
226
-
227
-
228
-
229
-
230
-
231
-
232
-
233
-
234
-
235
-
236
-
237
-
238
-
239
-
240
-
241
-
242
-
243
-
244
-
245
-
246
-
247
-
248
-
249
-
250
-
251
-
252
-
253
-
254
-
255
-
256
-
257
-
258
-
259
-
260
-
261
-
262
-
263
-
264
-
265
-
266
-
267
-
268
-
269
-
270
-
271
-
272
-
273
-
274
-
275
-
276
-
277
-
278
-
279
-
280
-
281
-
282
-
283
-
284
-
285
-
286
-
287
 |
 |

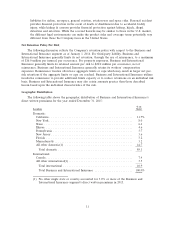
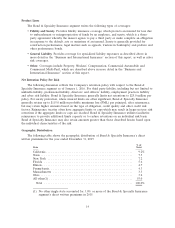
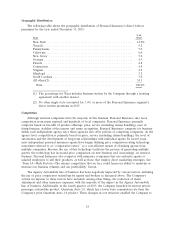
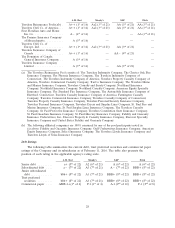
Geographic Distribution
The following table shows the geographic distribution of Personal Insurance’s direct written
premiums for the year ended December 31, 2015:
% of
State Total
New York ................................................. 14.2%
Texas(1) ................................................... 9.2
Pennsylvania ................................................ 7.0
California .................................................. 6.0
New Jersey ................................................ 5.0
Georgia ................................................... 4.9
Florida ................................................... 4.8
Connecticut ................................................ 4.4
Virginia ................................................... 4.2
Maryland .................................................. 3.2
South Carolina .............................................. 3.0
All others(2) ............................................... 34.1
Total ................................................... 100.0%
(1) The percentage for Texas includes business written by the Company through a fronting
agreement with another insurer.
(2) No other single state accounted for 3.0% or more of the Personal Insurance segment’s
direct written premiums in 2015.
Competition
Although national companies write the majority of this business, Personal Insurance also faces
competition from many regional and hundreds of local companies. Personal Insurance primarily
competes based on breadth of product offerings, price, service (including claims handling), ease of
doing business, stability of the insurer and name recognition. Personal Insurance competes for business
within each independent agency since these agencies also offer policies of competing companies. At the
agency level, competition is primarily based on price, service (including claims handling), the level of
automation and the development of long-term relationships with individual agents. In recent years,
most independent personal insurance agents have begun utilizing price comparison rating technology,
sometimes referred to as ‘‘comparative raters,’’ as a cost-efficient means of obtaining quotes from
multiple companies. Because the use of this technology facilitates the process of generating multiple
quotes, the technology has increased price comparison on new business and, increasingly, on renewal
business. Personal Insurance also competes with insurance companies that use exclusive agents or
salaried employees to sell their products, as well as those that employ direct marketing strategies. See
‘‘Item 1A—Risk Factors—The intense competition that we face could harm our ability to maintain or
increase our business volumes and our profitability’’ herein.
The Agency Automobile line of business has been negatively impacted by various factors, including
the use of price comparison technology by agents and brokers as discussed above. The Company’s
actions in response to these factors have included, among other things, the reduction of claim
adjustment and other insurance expenses, with the majority of the impact in the Agency Automobile
line of business. Additionally, in the fourth quarter of 2013, the Company launched its newest private
passenger automobile product, Quantum Auto 2.0, which has a lower base commission rate than the
Company’s prior Quantum Auto 1.0 product. These changes in cost structure enabled the Company to
18