Travelers 2015 Annual Report Download - page 190
Download and view the complete annual report
Please find page 190 of the 2015 Travelers annual report below. You can navigate through the pages in the report by either clicking on the pages listed below, or by using the keyword search tool below to find specific information within the annual report.-
 1
1 -
2
-
3
-
4
-
5
-
6
-
7
-
8
-
9
-
10
-
11
-
12
-
13
-
14
-
15
-
16
-
17
-
18
-
19
-
20
-
21
-
22
-
23
-
24
-
25
-
26
-
27
-
28
-
29
-
30
-
31
-
32
-
33
-
34
-
35
-
36
-
37
-
38
-
39
-
40
-
41
-
42
-
43
-
44
-
45
-
46
-
47
-
48
-
49
-
50
-
51
-
52
-
53
-
54
-
55
-
56
-
57
-
58
-
59
-
60
-
61
-
62
-
63
-
64
-
65
-
66
-
67
-
68
-
69
-
70
-
71
-
72
-
73
-
74
-
75
-
76
-
77
-
78
-
79
-
80
-
81
-
82
-
83
-
84
-
85
-
86
-
87
-
88
-
89
-
90
-
91
-
92
-
93
-
94
-
95
-
96
-
97
-
98
-
99
-
100
-
101
-
102
-
103
-
104
-
105
-
106
-
107
-
108
-
109
-
110
-
111
-
112
-
113
-
114
-
115
-
116
-
117
-
118
-
119
-
120
-
121
-
122
-
123
-
124
-
125
-
126
-
127
-
128
-
129
-
130
-
131
-
132
-
133
-
134
-
135
-
136
-
137
-
138
-
139
-
140
-
141
-
142
-
143
-
144
-
145
-
146
-
147
-
148
-
149
-
150
-
151
-
152
-
153
-
154
-
155
-
156
-
157
-
158
-
159
-
160
-
161
-
162
-
163
-
164
-
165
-
166
-
167
-
168
-
169
-
170
-
171
-
172
-
173
-
174
-
175
-
176
-
177
-
178
-
179
-
 180
180 -
 181
181 -
 182
182 -
 183
183 -
 184
184 -
 185
185 -
 186
186 -
 187
187 -
 188
188 -
 189
189 -
 190
190 -
 191
191 -
 192
192 -
 193
193 -
 194
194 -
 195
195 -
 196
196 -
 197
197 -
 198
198 -
 199
199 -
 200
200 -
201
-
202
-
203
-
204
-
205
-
206
-
207
-
208
-
209
-
210
-
211
-
212
-
213
-
214
-
215
-
216
-
217
-
218
-
219
-
220
-
221
-
222
-
223
-
224
-
225
-
226
-
227
-
228
-
229
-
230
-
231
-
232
-
233
-
234
-
235
-
236
-
237
-
238
-
239
-
240
-
241
-
242
-
243
-
244
-
245
-
246
-
247
-
248
-
249
-
250
-
251
-
252
-
253
-
254
-
255
-
256
-
257
-
258
-
259
-
260
-
261
-
262
-
263
-
264
-
265
-
266
-
267
-
268
-
269
-
270
-
271
-
272
-
273
-
274
-
275
-
276
-
277
-
278
-
279
-
280
-
281
-
282
-
283
-
284
-
285
-
286
-
287
 |
 |

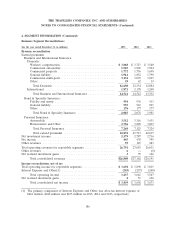
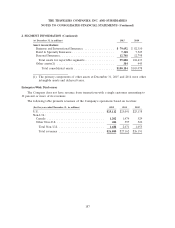
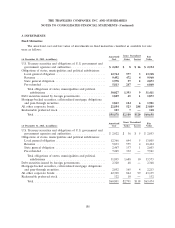
THE TRAVELERS COMPANIES, INC. AND SUBSIDIARIES
NOTES TO CONSOLIDATED FINANCIAL STATEMENTS (Continued)
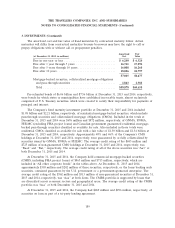
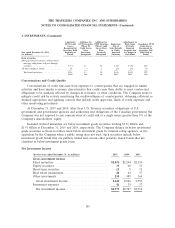
3. INVESTMENTS (Continued)
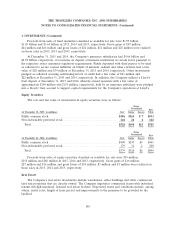
Proceeds from sales of fixed maturities classified as available for sale were $1.95 billion,
$1.05 billion and $1.64 billion in 2015, 2014 and 2013, respectively. Gross gains of $95 million,
$44 million and $66 million and gross losses of $14 million, $12 million and $25 million were realized
on those sales in 2015, 2014 and 2013, respectively.
At December 31, 2015 and 2014, the Company’s insurance subsidiaries had $4.66 billion and
$4.78 billion, respectively, of securities on deposit at financial institutions in certain states pursuant to
the respective states’ insurance regulatory requirements. Funds deposited with third parties to be used
as collateral to secure various liabilities on behalf of insureds, cedants and other creditors had a fair
value of $28 million and $39 million at December 31, 2015 and 2014, respectively. Other investments
pledged as collateral securing outstanding letters of credit had a fair value of $21 million and
$22 million at December 31, 2015 and 2014, respectively. In addition, the Company utilized a Lloyd’s
trust deposit at December 31, 2015 and 2014, whereby owned securities with a fair value of
approximately $140 million and $151 million, respectively, held by an insurance subsidiary were pledged
into a Lloyd’s trust account to support capital requirements for the Company’s operations at Lloyd’s.
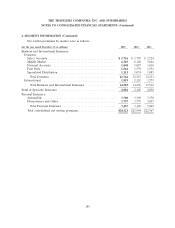
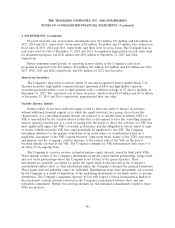
Equity Securities
The cost and fair value of investments in equity securities were as follows:
Gross
Unrealized Fair
(at December 31, 2015, in millions) Cost Gains Losses Value
Public common stock ...................................... $386 $164 $ 7 $543
Non-redeemable preferred stock .............................. 142 26 6 162
Total ................................................. $528 $190 $13 $705
Gross
Unrealized Fair
(at December 31, 2014, in millions) Cost Gains Losses Value
Public common stock ...................................... $400 $295 $4 $691
Non-redeemable preferred stock .............................. 179 31 2 208
Total ................................................. $579 $326 $6 $899
Proceeds from sales of equity securities classified as available for sale were $59 million,
$158 million and $86 million in 2015, 2014 and 2013, respectively. Gross gains of $16 million,
$27 million and $16 million and gross losses of $10 million, $3 million and $1 million were realized on
those sales in 2015, 2014 and 2013, respectively.
Real Estate
The Company’s real estate investments include warehouses, office buildings and other commercial
land and properties that are directly owned. The Company negotiates commercial leases with individual
tenants through unrelated, licensed real estate brokers. Negotiated terms and conditions include, among
others, rental rates, length of lease period and improvements to the premises to be provided by the
landlord.
190