Travelers 2015 Annual Report Download - page 82
Download and view the complete annual report
Please find page 82 of the 2015 Travelers annual report below. You can navigate through the pages in the report by either clicking on the pages listed below, or by using the keyword search tool below to find specific information within the annual report.-
 1
1 -
2
-
3
-
4
-
5
-
6
-
7
-
8
-
9
-
10
-
11
-
12
-
13
-
14
-
15
-
16
-
17
-
18
-
19
-
20
-
21
-
22
-
23
-
24
-
25
-
26
-
27
-
28
-
29
-
30
-
31
-
32
-
33
-
34
-
35
-
36
-
37
-
38
-
39
-
40
-
41
-
42
-
43
-
44
-
45
-
46
-
47
-
48
-
49
-
50
-
51
-
52
-
53
-
54
-
55
-
56
-
57
-
58
-
59
-
60
-
61
-
62
-
63
-
64
-
65
-
66
-
67
-
68
-
69
-
70
-
71
-
 72
72 -
 73
73 -
 74
74 -
 75
75 -
 76
76 -
 77
77 -
 78
78 -
 79
79 -
 80
80 -
 81
81 -
 82
82 -
 83
83 -
 84
84 -
 85
85 -
 86
86 -
 87
87 -
 88
88 -
 89
89 -
 90
90 -
 91
91 -
 92
92 -
93
-
94
-
95
-
96
-
97
-
98
-
99
-
100
-
101
-
102
-
103
-
104
-
105
-
106
-
107
-
108
-
109
-
110
-
111
-
112
-
113
-
114
-
115
-
116
-
117
-
118
-
119
-
120
-
121
-
122
-
123
-
124
-
125
-
126
-
127
-
128
-
129
-
130
-
131
-
132
-
133
-
134
-
135
-
136
-
137
-
138
-
139
-
140
-
141
-
142
-
143
-
144
-
145
-
146
-
147
-
148
-
149
-
150
-
151
-
152
-
153
-
154
-
155
-
156
-
157
-
158
-
159
-
160
-
161
-
162
-
163
-
164
-
165
-
166
-
167
-
168
-
169
-
170
-
171
-
172
-
173
-
174
-
175
-
176
-
177
-
178
-
179
-
180
-
181
-
182
-
183
-
184
-
185
-
186
-
187
-
188
-
189
-
190
-
191
-
192
-
193
-
194
-
195
-
196
-
197
-
198
-
199
-
200
-
201
-
202
-
203
-
204
-
205
-
206
-
207
-
208
-
209
-
210
-
211
-
212
-
213
-
214
-
215
-
216
-
217
-
218
-
219
-
220
-
221
-
222
-
223
-
224
-
225
-
226
-
227
-
228
-
229
-
230
-
231
-
232
-
233
-
234
-
235
-
236
-
237
-
238
-
239
-
240
-
241
-
242
-
243
-
244
-
245
-
246
-
247
-
248
-
249
-
250
-
251
-
252
-
253
-
254
-
255
-
256
-
257
-
258
-
259
-
260
-
261
-
262
-
263
-
264
-
265
-
266
-
267
-
268
-
269
-
270
-
271
-
272
-
273
-
274
-
275
-
276
-
277
-
278
-
279
-
280
-
281
-
282
-
283
-
284
-
285
-
286
-
287
 |
 |
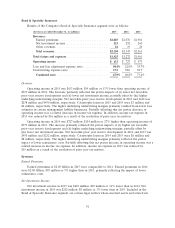
Other Net Realized Investment Gains
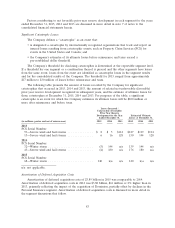
Other net realized investment gains in 2015 included $81 million of net realized gains related to
fixed maturity investments, $6 million of net realized investment gains related to equity securities,
$2 million of net realized investment gains from real estate sales and $34 million of net realized
investment losses related to other investments. The net realized investment losses related to other
investments included $26 million of realized foreign exchange translation losses incurred in connection
with the Company’s increased ownership of Travelers Participa¸c˜
oes em Seguros Brasil S.A.
Other net realized investment gains in 2014 included $35 million of net realized gains resulting
from the sale of substantially all of one of the Company’s real estate joint venture investments. The
remaining $70 million of other net realized gains in 2014 were primarily driven by $32 million of net
realized investment gains related to fixed maturity investments, $24 million of net realized investment
gains related to equity securities, $8 million of net realized investment gains related to other
investments and $6 million of net realized investment gains from real estate sales.
Other net realized gains in 2013 of $181 million included $115 million of net realized gains
associated with U.S. Treasury futures contracts, which require daily mark-to-market settlement and are
used from time to time to shorten the duration of the Company’s fixed maturity investment portfolio.
The remaining $66 million of other net realized investment gains in 2013 were primarily driven by
$41 million of net realized investment gains related to fixed maturity investments, $15 million of net
realized investment gains related to equity securities and $10 million of net realized investment gains
related to other investments.
Other Revenues
Other revenues in all years presented included installment premium charges. Other revenues in
2014 and 2013 also included revenues associated with the runoff of the Company’s National Flood
Insurance Program (NFIP) business that was sold on a renewal rights basis in 2013. Other revenues in
2013 also included a $91 million gain from the settlement of a legal proceeding, which is discussed in
more detail in note 16 of notes to the consolidated financial statements herein, and a $20 million gain
from the sale of the NFIP renewal rights.
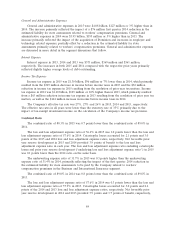
Claims and Expenses
Claims and Claim Adjustment Expenses
Claims and claim adjustment expenses in 2015 were $13.72 billion, $147 million or 1% lower than
in 2014, primarily reflecting (i) lower catastrophe losses and (ii) lower non-catastrophe weather-related
losses, partially offset by (iii) the impact of loss cost trends. Catastrophe losses in 2015 included
wildfires in California, hail and wind storms in several regions of the United States and winter storms
in several regions of the United States. Catastrophe losses in 2014 included multiple wind and hail
storms in several regions of the United States and a winter storm in the Mid-Atlantic, Midwestern and
Southeastern regions of the United States.
Claims and claim adjustment expenses in 2014 were $13.87 billion, $563 million or 4% higher than
in 2013, primarily reflecting (i) the impact of the acquisition of Dominion, (ii) the impact of loss cost
trends, (iii) higher non-catastrophe weather-related losses, (iv) higher catastrophe losses and (v) a
higher level of what the Company defines as large losses, partially offset by (vi) the impact of lower
volumes of insured exposures (excluding the impact of the acquisition of Dominion) and (vii) higher
net favorable prior year reserve development. Catastrophe losses in 2013 resulted from multiple
tornado, wind and hail storms in several regions of the United States, as well as floods in Alberta,
Canada and Storm Xaver in the United Kingdom.
82