Travelers 2015 Annual Report Download - page 148
Download and view the complete annual report
Please find page 148 of the 2015 Travelers annual report below. You can navigate through the pages in the report by either clicking on the pages listed below, or by using the keyword search tool below to find specific information within the annual report.-
 1
1 -
2
-
3
-
4
-
5
-
6
-
7
-
8
-
9
-
10
-
11
-
12
-
13
-
14
-
15
-
16
-
17
-
18
-
19
-
20
-
21
-
22
-
23
-
24
-
25
-
26
-
27
-
28
-
29
-
30
-
31
-
32
-
33
-
34
-
35
-
36
-
37
-
38
-
39
-
40
-
41
-
42
-
43
-
44
-
45
-
46
-
47
-
48
-
49
-
50
-
51
-
52
-
53
-
54
-
55
-
56
-
57
-
58
-
59
-
60
-
61
-
62
-
63
-
64
-
65
-
66
-
67
-
68
-
69
-
70
-
71
-
72
-
73
-
74
-
75
-
76
-
77
-
78
-
79
-
80
-
81
-
82
-
83
-
84
-
85
-
86
-
87
-
88
-
89
-
90
-
91
-
92
-
93
-
94
-
95
-
96
-
97
-
98
-
99
-
100
-
101
-
102
-
103
-
104
-
105
-
106
-
107
-
108
-
109
-
110
-
111
-
112
-
113
-
114
-
115
-
116
-
117
-
118
-
119
-
120
-
121
-
122
-
123
-
124
-
125
-
126
-
127
-
128
-
129
-
130
-
131
-
132
-
133
-
134
-
135
-
136
-
137
-
 138
138 -
 139
139 -
 140
140 -
 141
141 -
 142
142 -
 143
143 -
 144
144 -
 145
145 -
 146
146 -
 147
147 -
 148
148 -
 149
149 -
 150
150 -
 151
151 -
 152
152 -
 153
153 -
 154
154 -
 155
155 -
 156
156 -
 157
157 -
 158
158 -
159
-
160
-
161
-
162
-
163
-
164
-
165
-
166
-
167
-
168
-
169
-
170
-
171
-
172
-
173
-
174
-
175
-
176
-
177
-
178
-
179
-
180
-
181
-
182
-
183
-
184
-
185
-
186
-
187
-
188
-
189
-
190
-
191
-
192
-
193
-
194
-
195
-
196
-
197
-
198
-
199
-
200
-
201
-
202
-
203
-
204
-
205
-
206
-
207
-
208
-
209
-
210
-
211
-
212
-
213
-
214
-
215
-
216
-
217
-
218
-
219
-
220
-
221
-
222
-
223
-
224
-
225
-
226
-
227
-
228
-
229
-
230
-
231
-
232
-
233
-
234
-
235
-
236
-
237
-
238
-
239
-
240
-
241
-
242
-
243
-
244
-
245
-
246
-
247
-
248
-
249
-
250
-
251
-
252
-
253
-
254
-
255
-
256
-
257
-
258
-
259
-
260
-
261
-
262
-
263
-
264
-
265
-
266
-
267
-
268
-
269
-
270
-
271
-
272
-
273
-
274
-
275
-
276
-
277
-
278
-
279
-
280
-
281
-
282
-
283
-
284
-
285
-
286
-
287
 |
 |

• Litigation trends
• Frequency of claims with payment capped by policy limits
• Change in average severity of accidents, or proportion of severe accidents
• Subrogation opportunities
• Degree of patient responsiveness to treatment
• Changes in claim handling philosophies
No-fault risk factors (for selected states and time periods)
• Effectiveness of no-fault laws
• Frequency of visits to health providers
• Number of medical procedures given during visits to health providers
• Types of health providers used
• Types of medical treatments received
• Changes in cost of medical treatments
• Degree of patient responsiveness to treatment
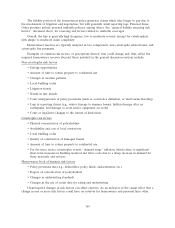
Personal automobile book of business risk factors
• Changes in policy provisions (e.g., deductibles, policy limits, endorsements, etc.)
• Changes in underwriting standards
• Changes in the use of credit data for rating and underwriting
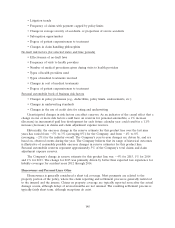
Unanticipated changes in risk factors can affect reserves. As an indicator of the causal effect that a
change in one or more risk factors could have on reserves for personal automobile, a 1% increase
(decrease) in incremental paid loss development for each future calendar year could result in a 1.1%
increase (decrease) in claims and claim adjustment expense reserves.
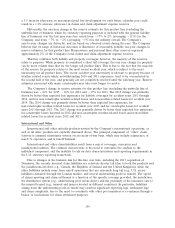
Historically, the one-year change in the reserve estimate for this product line over the last nine
years has varied from 5% to 3% (averaging 0%) for the Company, and from 4% to 0%
(averaging 2%) for the industry overall. The Company’s year-to-year changes are driven by, and are
based on, observed events during the year. The Company believes that its range of historical outcomes
is illustrative of reasonably possible one-year changes in reserve estimates for this product line.
Personal automobile reserves represent approximately 5% of the Company’s total claims and claim
adjustment expense reserves.
The Company’s change in reserve estimate for this product line was 4% for 2015, 1% for 2014
and 1% for 2013. The change for 2015 was primarily driven by better than expected loss experience for
liability coverages for accident years 2012 through 2014.
Homeowners and Personal Lines Other
Homeowners is generally considered a short tail coverage. Most payments are related to the
property portion of the policy, where the claim reporting and settlement process is generally restricted
to the insured and the insurer. Claims on property coverage are typically reported soon after the actual
damage occurs, although delays of several months are not unusual. The resulting settlement process is
typically fairly short term, although exceptions do exist.
148