Travelers 2015 Annual Report Download - page 112
Download and view the complete annual report
Please find page 112 of the 2015 Travelers annual report below. You can navigate through the pages in the report by either clicking on the pages listed below, or by using the keyword search tool below to find specific information within the annual report.-
 1
1 -
2
-
3
-
4
-
5
-
6
-
7
-
8
-
9
-
10
-
11
-
12
-
13
-
14
-
15
-
16
-
17
-
18
-
19
-
20
-
21
-
22
-
23
-
24
-
25
-
26
-
27
-
28
-
29
-
30
-
31
-
32
-
33
-
34
-
35
-
36
-
37
-
38
-
39
-
40
-
41
-
42
-
43
-
44
-
45
-
46
-
47
-
48
-
49
-
50
-
51
-
52
-
53
-
54
-
55
-
56
-
57
-
58
-
59
-
60
-
61
-
62
-
63
-
64
-
65
-
66
-
67
-
68
-
69
-
70
-
71
-
72
-
73
-
74
-
75
-
76
-
77
-
78
-
79
-
80
-
81
-
82
-
83
-
84
-
85
-
86
-
87
-
88
-
89
-
90
-
91
-
92
-
93
-
94
-
95
-
96
-
97
-
98
-
99
-
100
-
101
-
 102
102 -
 103
103 -
 104
104 -
 105
105 -
 106
106 -
 107
107 -
 108
108 -
 109
109 -
 110
110 -
 111
111 -
 112
112 -
 113
113 -
 114
114 -
 115
115 -
 116
116 -
 117
117 -
 118
118 -
 119
119 -
 120
120 -
 121
121 -
 122
122 -
123
-
124
-
125
-
126
-
127
-
128
-
129
-
130
-
131
-
132
-
133
-
134
-
135
-
136
-
137
-
138
-
139
-
140
-
141
-
142
-
143
-
144
-
145
-
146
-
147
-
148
-
149
-
150
-
151
-
152
-
153
-
154
-
155
-
156
-
157
-
158
-
159
-
160
-
161
-
162
-
163
-
164
-
165
-
166
-
167
-
168
-
169
-
170
-
171
-
172
-
173
-
174
-
175
-
176
-
177
-
178
-
179
-
180
-
181
-
182
-
183
-
184
-
185
-
186
-
187
-
188
-
189
-
190
-
191
-
192
-
193
-
194
-
195
-
196
-
197
-
198
-
199
-
200
-
201
-
202
-
203
-
204
-
205
-
206
-
207
-
208
-
209
-
210
-
211
-
212
-
213
-
214
-
215
-
216
-
217
-
218
-
219
-
220
-
221
-
222
-
223
-
224
-
225
-
226
-
227
-
228
-
229
-
230
-
231
-
232
-
233
-
234
-
235
-
236
-
237
-
238
-
239
-
240
-
241
-
242
-
243
-
244
-
245
-
246
-
247
-
248
-
249
-
250
-
251
-
252
-
253
-
254
-
255
-
256
-
257
-
258
-
259
-
260
-
261
-
262
-
263
-
264
-
265
-
266
-
267
-
268
-
269
-
270
-
271
-
272
-
273
-
274
-
275
-
276
-
277
-
278
-
279
-
280
-
281
-
282
-
283
-
284
-
285
-
286
-
287
 |
 |

interest. The Company has not incurred any investment losses in its securities lending program for the
years ended December 31, 2015, 2014 and 2013.
Lloyd’s Trust Deposit
The Company utilizes a Lloyd’s trust deposit, whereby owned securities with a fair value of
approximately $140 million and $151 million held by a wholly-owned subsidiary at December 31, 2015
and 2014, respectively, were pledged into a Lloyd’s trust account to provide a portion of the capital
needed to support the Company’s obligations at Lloyd’s.
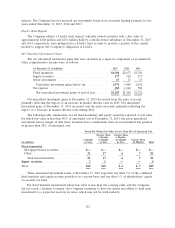
Net Unrealized Investment Gains
The net unrealized investment gains that were included as a separate component of accumulated
other comprehensive income were as follows:
(at December 31, in millions) 2015 2014 2013
Fixed maturities ............................... $1,780 $2,673 $1,760
Equity securities ............................... 177 320 257
Other investments ............................. 17 15 13
Unrealized investment gains before tax ............. 1,974 3,008 2,030
Tax expense .................................. 685 1,042 708
Net unrealized investment gains at end of year ....... $1,289 $1,966 $1,322
Net unrealized investment gains at December 31, 2015 decreased from the prior year-end,
primarily reflecting the impact of an increase in market interest rates in 2015. Net unrealized
investment gains at December 31, 2014 increased over the prior year-end, primarily reflecting the
impact of a decrease in market interest rates during 2014.
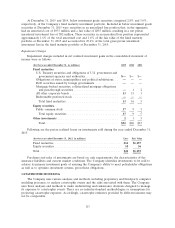
The following table summarizes, for all fixed maturities and equity securities reported at fair value
for which fair value is less than 80% of amortized cost at December 31, 2015, the gross unrealized
investment loss by length of time those securities have continuously been in an unrealized loss position
of greater than 20% of amortized cost:
Period For Which Fair Value Is Less Than 80% of Amortized Cost
Greater Than Greater Than
3 Months, 6 Months,
3 Months 6 Months 12 Months Greater Than
(in millions) or Less or Less or Less 12 Months Total
Fixed maturities:
Mortgage-backed securities ............ $— $— $— $— $—
Other ........................... 51 17 6 7 81
Total fixed maturities ............... 51 17 6 7 81
Equity securities ..................... 31——4
Total .............................. $54 $18 $ 6 $ 7 $85
These unrealized investment losses at December 31, 2015 represent less than 1% of the combined
fixed maturity and equity security portfolios on a pretax basis and less than 1% of shareholders’ equity
on an after-tax basis.
For fixed maturity investments where fair value is less than the carrying value and the Company
did not reach a decision to impair, the Company continues to have the intent and ability to hold such
investments to a projected recovery in value, which may not be until maturity.
112