Travelers 2015 Annual Report Download - page 85
Download and view the complete annual report
Please find page 85 of the 2015 Travelers annual report below. You can navigate through the pages in the report by either clicking on the pages listed below, or by using the keyword search tool below to find specific information within the annual report.-
 1
1 -
2
-
3
-
4
-
5
-
6
-
7
-
8
-
9
-
10
-
11
-
12
-
13
-
14
-
15
-
16
-
17
-
18
-
19
-
20
-
21
-
22
-
23
-
24
-
25
-
26
-
27
-
28
-
29
-
30
-
31
-
32
-
33
-
34
-
35
-
36
-
37
-
38
-
39
-
40
-
41
-
42
-
43
-
44
-
45
-
46
-
47
-
48
-
49
-
50
-
51
-
52
-
53
-
54
-
55
-
56
-
57
-
58
-
59
-
60
-
61
-
62
-
63
-
64
-
65
-
66
-
67
-
68
-
69
-
70
-
71
-
72
-
73
-
74
-
 75
75 -
 76
76 -
 77
77 -
 78
78 -
 79
79 -
 80
80 -
 81
81 -
 82
82 -
 83
83 -
 84
84 -
 85
85 -
 86
86 -
 87
87 -
 88
88 -
 89
89 -
 90
90 -
 91
91 -
 92
92 -
 93
93 -
 94
94 -
 95
95 -
96
-
97
-
98
-
99
-
100
-
101
-
102
-
103
-
104
-
105
-
106
-
107
-
108
-
109
-
110
-
111
-
112
-
113
-
114
-
115
-
116
-
117
-
118
-
119
-
120
-
121
-
122
-
123
-
124
-
125
-
126
-
127
-
128
-
129
-
130
-
131
-
132
-
133
-
134
-
135
-
136
-
137
-
138
-
139
-
140
-
141
-
142
-
143
-
144
-
145
-
146
-
147
-
148
-
149
-
150
-
151
-
152
-
153
-
154
-
155
-
156
-
157
-
158
-
159
-
160
-
161
-
162
-
163
-
164
-
165
-
166
-
167
-
168
-
169
-
170
-
171
-
172
-
173
-
174
-
175
-
176
-
177
-
178
-
179
-
180
-
181
-
182
-
183
-
184
-
185
-
186
-
187
-
188
-
189
-
190
-
191
-
192
-
193
-
194
-
195
-
196
-
197
-
198
-
199
-
200
-
201
-
202
-
203
-
204
-
205
-
206
-
207
-
208
-
209
-
210
-
211
-
212
-
213
-
214
-
215
-
216
-
217
-
218
-
219
-
220
-
221
-
222
-
223
-
224
-
225
-
226
-
227
-
228
-
229
-
230
-
231
-
232
-
233
-
234
-
235
-
236
-
237
-
238
-
239
-
240
-
241
-
242
-
243
-
244
-
245
-
246
-
247
-
248
-
249
-
250
-
251
-
252
-
253
-
254
-
255
-
256
-
257
-
258
-
259
-
260
-
261
-
262
-
263
-
264
-
265
-
266
-
267
-
268
-
269
-
270
-
271
-
272
-
273
-
274
-
275
-
276
-
277
-
278
-
279
-
280
-
281
-
282
-
283
-
284
-
285
-
286
-
287
 |
 |

to the loss and loss adjustment expense ratio. The underlying loss and loss adjustment expense ratio in
2014 was 0.5 points lower than the 2013 ratio on the same basis, primarily reflecting the impact of
earned pricing that exceeded loss cost trends, partially offset by the impact of an increase in
non-catastrophe weather-related losses and a higher level of what the Company defines as large losses.
The underwriting expense ratio of 31.4% in 2014 was 0.5 points lower than the underwriting expense
ratio of 31.9% in 2013, primarily reflecting lower commission expenses in the Personal Insurance segment
and a reduction in the estimated liability for state assessments primarily related to workers’ compensation
premiums in the Business and International Insurance segment, partially offset by the impact of the
acquisition of Dominion and increases in employee and technology related expenses.
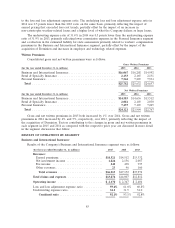
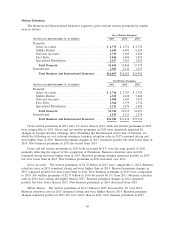
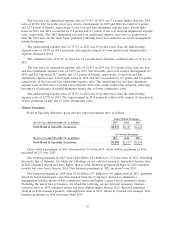
Written Premiums
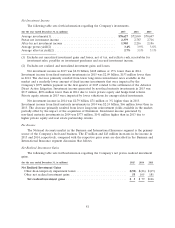
Consolidated gross and net written premiums were as follows:
Gross Written Premiums
(for the year ended December 31, in millions) 2015 2014 2013
Business and International Insurance ........................... $16,067 $16,202 $14,992
Bond & Specialty Insurance ................................. 2,153 2,165 2,131
Personal Insurance ........................................ 7,562 7,265 7,534
Total ................................................ $25,782 $25,632 $24,657
Net Written Premiums
(for the year ended December 31, in millions) 2015 2014 2013
Business and International Insurance ........................... $14,583 $14,636 $13,512
Bond & Specialty Insurance ................................. 2,081 2,103 2,030
Personal Insurance ........................................ 7,457 7,165 7,225
Total ................................................ $24,121 $23,904 $22,767
Gross and net written premiums in 2015 both increased by 1% over 2014. Gross and net written
premiums in 2014 increased by 4% and 5%, respectively, over 2013, primarily reflecting the impact of
the acquisition of Dominion. Factors contributing to the changes in gross and net written premiums in
each segment in 2015 and 2014 as compared with the respective prior year are discussed in more detail
in the segment discussions that follow.
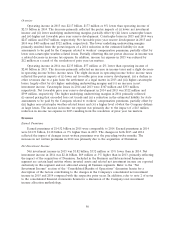
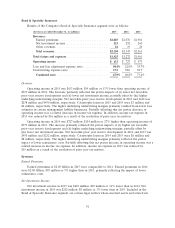
RESULTS OF OPERATIONS BY SEGMENT
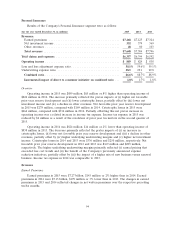
Business and International Insurance
Results of the Company’s Business and International Insurance segment were as follows:
(for the year ended December 31, in millions) 2015 2014 2013
Revenues:
Earned premiums ......................... $14,521 $14,512 $13,332
Net investment income ..................... 1,824 2,156 2,087
Fee income ............................. 445 438 395
Other revenues ........................... 23 46 160
Total revenues .......................... $16,813 $17,152 $15,974
Total claims and expenses .................... $13,874 $14,007 $12,812
Operating income .......................... $ 2,170 $ 2,347 $ 2,404
Loss and loss adjustment expense ratio ........... 59.6% 61.6% 60.8%
Underwriting expense ratio .................... 32.5 31.5 32.0
Combined ratio ......................... 92.1% 93.1% 92.8%
85