Travelers 2015 Annual Report Download - page 89
Download and view the complete annual report
Please find page 89 of the 2015 Travelers annual report below. You can navigate through the pages in the report by either clicking on the pages listed below, or by using the keyword search tool below to find specific information within the annual report.-
 1
1 -
2
-
3
-
4
-
5
-
6
-
7
-
8
-
9
-
10
-
11
-
12
-
13
-
14
-
15
-
16
-
17
-
18
-
19
-
20
-
21
-
22
-
23
-
24
-
25
-
26
-
27
-
28
-
29
-
30
-
31
-
32
-
33
-
34
-
35
-
36
-
37
-
38
-
39
-
40
-
41
-
42
-
43
-
44
-
45
-
46
-
47
-
48
-
49
-
50
-
51
-
52
-
53
-
54
-
55
-
56
-
57
-
58
-
59
-
60
-
61
-
62
-
63
-
64
-
65
-
66
-
67
-
68
-
69
-
70
-
71
-
72
-
73
-
74
-
75
-
76
-
77
-
78
-
 79
79 -
 80
80 -
 81
81 -
 82
82 -
 83
83 -
 84
84 -
 85
85 -
 86
86 -
 87
87 -
 88
88 -
 89
89 -
 90
90 -
 91
91 -
 92
92 -
 93
93 -
 94
94 -
 95
95 -
 96
96 -
 97
97 -
 98
98 -
 99
99 -
100
-
101
-
102
-
103
-
104
-
105
-
106
-
107
-
108
-
109
-
110
-
111
-
112
-
113
-
114
-
115
-
116
-
117
-
118
-
119
-
120
-
121
-
122
-
123
-
124
-
125
-
126
-
127
-
128
-
129
-
130
-
131
-
132
-
133
-
134
-
135
-
136
-
137
-
138
-
139
-
140
-
141
-
142
-
143
-
144
-
145
-
146
-
147
-
148
-
149
-
150
-
151
-
152
-
153
-
154
-
155
-
156
-
157
-
158
-
159
-
160
-
161
-
162
-
163
-
164
-
165
-
166
-
167
-
168
-
169
-
170
-
171
-
172
-
173
-
174
-
175
-
176
-
177
-
178
-
179
-
180
-
181
-
182
-
183
-
184
-
185
-
186
-
187
-
188
-
189
-
190
-
191
-
192
-
193
-
194
-
195
-
196
-
197
-
198
-
199
-
200
-
201
-
202
-
203
-
204
-
205
-
206
-
207
-
208
-
209
-
210
-
211
-
212
-
213
-
214
-
215
-
216
-
217
-
218
-
219
-
220
-
221
-
222
-
223
-
224
-
225
-
226
-
227
-
228
-
229
-
230
-
231
-
232
-
233
-
234
-
235
-
236
-
237
-
238
-
239
-
240
-
241
-
242
-
243
-
244
-
245
-
246
-
247
-
248
-
249
-
250
-
251
-
252
-
253
-
254
-
255
-
256
-
257
-
258
-
259
-
260
-
261
-
262
-
263
-
264
-
265
-
266
-
267
-
268
-
269
-
270
-
271
-
272
-
273
-
274
-
275
-
276
-
277
-
278
-
279
-
280
-
281
-
282
-
283
-
284
-
285
-
286
-
287
 |
 |

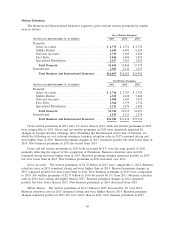
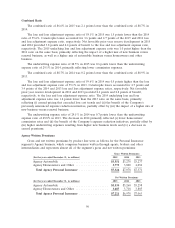
Written Premiums
The Business and International Insurance segment’s gross and net written premiums by market
were as follows:
Gross Written Premiums
(for the year ended December 31, in millions) 2015 2014 2013
Domestic:
Select Accounts ........................... $ 2,773 $ 2,754 $ 2,774
Middle Market ............................ 6,645 6,489 6,250
National Accounts ......................... 1,725 1,690 1,606
First Party ............................... 1,844 1,846 1,855
Specialized Distribution ..................... 1,117 1,081 1,092
Total Domestic .......................... 14,104 13,860 13,577
International ............................... 1,963 2,342 1,415
Total Business and International Insurance ..... $16,067 $16,202 $14,992
Net Written Premiums
(for the year ended December 31, in millions) 2015 2014 2013
Domestic:
Select Accounts ........................... $ 2,716 $ 2,707 $ 2,724
Middle Market ............................ 6,325 6,108 5,862
National Accounts ......................... 1,048 1,047 1,010
First Party ............................... 1,564 1,579 1,552
Specialized Distribution ..................... 1,111 1,074 1,085
Total Domestic .......................... 12,764 12,515 12,233
International ............................... 1,819 2,121 1,279
Total Business and International Insurance ..... $14,583 $14,636 $13,512
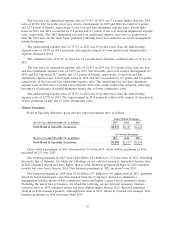
Gross written premiums in 2015 were 1% lower than in 2014, while net written premiums in 2015
were comparable to 2014. Gross and net written premiums in 2015 were negatively impacted by
changes in foreign currency exchange rates. Excluding the International surety line of business, for
which the following are not relevant measures, business retention rates in 2015 remained strong and
were higher than in 2014. Renewal premium changes in 2015 remained positive but were lower than in
2014. New business premiums in 2015 decreased from 2014.
Gross and net written premiums in 2014 both increased by 8% over the same period of 2013,
primarily reflecting the impact of the acquisition of Dominion. Business retention rates in 2014
remained strong and were higher than in 2013. Renewal premium changes remained positive in 2014
but were lower than in 2013. New business premiums in 2014 increased over 2013.
Select Accounts. Net written premiums of $2.72 billion in 2015 were comparable to 2014. Business
retention rates in 2015 remained strong and were higher than in 2014. Renewal premium changes in
2015 remained positive but were lower than in 2014. New business premiums in 2015 were comparable
to 2014. Net written premiums of $2.71 billion in 2014 decreased by 1% from 2013. Business retention
rates in 2014 were strong and higher than in 2013. Renewal premium changes in 2014 remained
positive but were lower than in 2013. New business premiums in 2014 decreased from 2013.
Middle Market. Net written premiums of $6.33 billion in 2015 increased by 4% over 2014.
Business retention rates in 2015 remained strong and were higher than in 2014. Renewal premium
changes remained positive in 2015 but were lower than in 2014. New business premiums in 2015
89