Travelers 2015 Annual Report Download - page 25
Download and view the complete annual report
Please find page 25 of the 2015 Travelers annual report below. You can navigate through the pages in the report by either clicking on the pages listed below, or by using the keyword search tool below to find specific information within the annual report.-
 1
1 -
2
-
3
-
4
-
5
-
6
-
7
-
8
-
9
-
10
-
11
-
12
-
13
-
14
-
 15
15 -
 16
16 -
 17
17 -
 18
18 -
 19
19 -
 20
20 -
 21
21 -
 22
22 -
 23
23 -
 24
24 -
 25
25 -
 26
26 -
 27
27 -
 28
28 -
 29
29 -
 30
30 -
 31
31 -
 32
32 -
 33
33 -
 34
34 -
 35
35 -
36
-
37
-
38
-
39
-
40
-
41
-
42
-
43
-
44
-
45
-
46
-
47
-
48
-
49
-
50
-
51
-
52
-
53
-
54
-
55
-
56
-
57
-
58
-
59
-
60
-
61
-
62
-
63
-
64
-
65
-
66
-
67
-
68
-
69
-
70
-
71
-
72
-
73
-
74
-
75
-
76
-
77
-
78
-
79
-
80
-
81
-
82
-
83
-
84
-
85
-
86
-
87
-
88
-
89
-
90
-
91
-
92
-
93
-
94
-
95
-
96
-
97
-
98
-
99
-
100
-
101
-
102
-
103
-
104
-
105
-
106
-
107
-
108
-
109
-
110
-
111
-
112
-
113
-
114
-
115
-
116
-
117
-
118
-
119
-
120
-
121
-
122
-
123
-
124
-
125
-
126
-
127
-
128
-
129
-
130
-
131
-
132
-
133
-
134
-
135
-
136
-
137
-
138
-
139
-
140
-
141
-
142
-
143
-
144
-
145
-
146
-
147
-
148
-
149
-
150
-
151
-
152
-
153
-
154
-
155
-
156
-
157
-
158
-
159
-
160
-
161
-
162
-
163
-
164
-
165
-
166
-
167
-
168
-
169
-
170
-
171
-
172
-
173
-
174
-
175
-
176
-
177
-
178
-
179
-
180
-
181
-
182
-
183
-
184
-
185
-
186
-
187
-
188
-
189
-
190
-
191
-
192
-
193
-
194
-
195
-
196
-
197
-
198
-
199
-
200
-
201
-
202
-
203
-
204
-
205
-
206
-
207
-
208
-
209
-
210
-
211
-
212
-
213
-
214
-
215
-
216
-
217
-
218
-
219
-
220
-
221
-
222
-
223
-
224
-
225
-
226
-
227
-
228
-
229
-
230
-
231
-
232
-
233
-
234
-
235
-
236
-
237
-
238
-
239
-
240
-
241
-
242
-
243
-
244
-
245
-
246
-
247
-
248
-
249
-
250
-
251
-
252
-
253
-
254
-
255
-
256
-
257
-
258
-
259
-
260
-
261
-
262
-
263
-
264
-
265
-
266
-
267
-
268
-
269
-
270
-
271
-
272
-
273
-
274
-
275
-
276
-
277
-
278
-
279
-
280
-
281
-
282
-
283
-
284
-
285
-
286
-
287
 |
 |

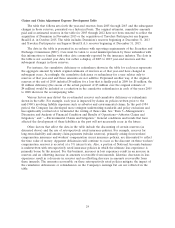
Because of these and other factors, it is difficult to develop a meaningful extrapolation of
estimated future redundancies or deficiencies in loss reserves from the data in the table.
(at December 31, in millions) 2005 2006 2007 2008 2009 2010 2011 2012 2013 2014 2015
Reserves for claims and claim
adjustment expense originally
estimated ............... $42,895 $42,844 $43,098 $41,312 $40,941 $40,255 $40,919 $40,634 $41,585 $41,036 $39,823
Cumulative amounts paid as of
One year later ............ 8,632 7,417 8,146 7,519 7,748 7,653 8,326 8,416 8,099 8,669
Two years later ............ 13,837 13,181 12,798 12,454 12,374 12,567 13,447 13,452 14,033
Three years later .......... 18,466 16,545 16,264 15,668 15,708 16,081 17,049 17,701
Four years later ........... 21,025 19,113 18,524 18,053 18,126 18,634 20,239
Five years later ........... 22,992 20,820 20,244 19,824 19,957 21,082
Six years later ............ 24,423 22,205 21,609 21,319 21,966
Seven years later .......... 25,616 23,381 22,869 23,075
Eight years later ........... 26,675 24,534 24,492
Nine years later ........... 27,741 26,059
Ten years later ............ 29,196
Reserves re-estimated as of
One year later ............ 42,466 42,172 41,373 39,863 39,524 39,413 39,845 39,690 40,628 40,139
Two years later ............ 42,311 40,837 39,925 38,640 38,421 38,393 38,964 38,931 39,875
Three years later .......... 41,692 39,739 38,842 37,613 37,539 37,576 38,402 38,511
Four years later ........... 40,855 38,734 38,223 36,892 36,889 37,179 38,196
Five years later ........... 40,026 38,409 37,716 36,361 36,605 37,046
Six years later ............ 39,849 38,134 37,323 36,240 36,516
Seven years later .......... 39,694 37,858 37,356 36,190
Eight years later ........... 39,518 37,977 37,388
Nine years later ........... 39,705 38,031
Ten years later ............ 39,847
Cumulative redundancy ........ (3,048) (4,813) (5,710) (5,122) (4,425) (3,209) (2,723) (2,123) (1,710) (897)
Gross liability—end of year ..... $61,461 $59,677 $58,094 $55,121 $53,529 $51,537 $51,353 $50,888 $50,865 $49,824 $48,272
Reinsurance recoverables ....... 18,566 16,833 14,996 13,809 12,588 11,282 10,434 10,254 9,280 8,788 8,449
Net liability—end of year ....... $42,895 $42,844 $43,098 $41,312 $40,941 $40,255 $40,919 $40,634 $41,585 $41,036 $39,823
Gross re-estimated liability-latest . . $57,819 $53,514 $51,099 $48,527 $47,783 $47,443 $48,092 $49,022 $49,171 $49,068
Re-estimated reinsurance
recoverables-latest .......... 17,972 15,483 13,711 12,337 11,267 10,397 9,896 10,511 9,296 8,929
Net re-estimated liability-latest . . . $39,847 $38,031 $37,388 $36,190 $36,516 $37,046 $38,196 $38,511 $39,875 $40,139
Gross cumulative redundancy .... $(3,642) $(6,163) $(6,995) $ (6,594) $ (5,746) $ (4,094) $ (3,261) $(1,866) $(1,694) $ (756)
For years prior to 2013, the table excludes reserves of Dominion, which were acquired by the
Company on November 1, 2013. Accordingly, the reserve development for years prior to 2013 does not
include reserve development recorded by Dominion. At December 31, 2013, Dominion’s gross reserves
were $2,110 million, and net reserves were $1,779 million. For years prior to 2015, the table excludes
the reserves of Travelers Participa¸c˜
oes em Seguros Brasil S.A., which were acquired by the Company on
October 1, 2015. Accordingly, the reserve development for years prior to 2015 does not include reserve
development recorded by Travelers Participa¸c˜
oes em Seguros Brasil S.A. At December 31, 2015, those
gross reserves were $3 million, and net reserves were $2 million.
In December 2008, the Company completed the sale of Unionamerica Holdings Limited
(Unionamerica), which comprised its United Kingdom-based runoff insurance and reinsurance
businesses. Immediately before the sale, the claims and claim adjustment expense reserves of
Unionamerica totaled $790 million. As a result of the sale, those obligations ceased being the
responsibility of the Company and its affiliates. The sale is reflected in the table as a reduction in
December 31, 2008 net reserves of $790 million and as a $790 million increase in paid losses for each
of the years 2005 through 2007 to reflect the transfer (payment) of the reserves to the buyer, resulting
in no impact to incurred losses.
25