Travelers 2015 Annual Report Download - page 93
Download and view the complete annual report
Please find page 93 of the 2015 Travelers annual report below. You can navigate through the pages in the report by either clicking on the pages listed below, or by using the keyword search tool below to find specific information within the annual report.-
 1
1 -
2
-
3
-
4
-
5
-
6
-
7
-
8
-
9
-
10
-
11
-
12
-
13
-
14
-
15
-
16
-
17
-
18
-
19
-
20
-
21
-
22
-
23
-
24
-
25
-
26
-
27
-
28
-
29
-
30
-
31
-
32
-
33
-
34
-
35
-
36
-
37
-
38
-
39
-
40
-
41
-
42
-
43
-
44
-
45
-
46
-
47
-
48
-
49
-
50
-
51
-
52
-
53
-
54
-
55
-
56
-
57
-
58
-
59
-
60
-
61
-
62
-
63
-
64
-
65
-
66
-
67
-
68
-
69
-
70
-
71
-
72
-
73
-
74
-
75
-
76
-
77
-
78
-
79
-
80
-
81
-
82
-
 83
83 -
 84
84 -
 85
85 -
 86
86 -
 87
87 -
 88
88 -
 89
89 -
 90
90 -
 91
91 -
 92
92 -
 93
93 -
 94
94 -
 95
95 -
 96
96 -
 97
97 -
 98
98 -
 99
99 -
 100
100 -
 101
101 -
 102
102 -
 103
103 -
104
-
105
-
106
-
107
-
108
-
109
-
110
-
111
-
112
-
113
-
114
-
115
-
116
-
117
-
118
-
119
-
120
-
121
-
122
-
123
-
124
-
125
-
126
-
127
-
128
-
129
-
130
-
131
-
132
-
133
-
134
-
135
-
136
-
137
-
138
-
139
-
140
-
141
-
142
-
143
-
144
-
145
-
146
-
147
-
148
-
149
-
150
-
151
-
152
-
153
-
154
-
155
-
156
-
157
-
158
-
159
-
160
-
161
-
162
-
163
-
164
-
165
-
166
-
167
-
168
-
169
-
170
-
171
-
172
-
173
-
174
-
175
-
176
-
177
-
178
-
179
-
180
-
181
-
182
-
183
-
184
-
185
-
186
-
187
-
188
-
189
-
190
-
191
-
192
-
193
-
194
-
195
-
196
-
197
-
198
-
199
-
200
-
201
-
202
-
203
-
204
-
205
-
206
-
207
-
208
-
209
-
210
-
211
-
212
-
213
-
214
-
215
-
216
-
217
-
218
-
219
-
220
-
221
-
222
-
223
-
224
-
225
-
226
-
227
-
228
-
229
-
230
-
231
-
232
-
233
-
234
-
235
-
236
-
237
-
238
-
239
-
240
-
241
-
242
-
243
-
244
-
245
-
246
-
247
-
248
-
249
-
250
-
251
-
252
-
253
-
254
-
255
-
256
-
257
-
258
-
259
-
260
-
261
-
262
-
263
-
264
-
265
-
266
-
267
-
268
-
269
-
270
-
271
-
272
-
273
-
274
-
275
-
276
-
277
-
278
-
279
-
280
-
281
-
282
-
283
-
284
-
285
-
286
-
287
 |
 |

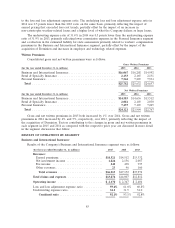
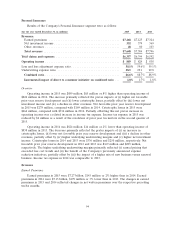
The loss and loss adjustment expense ratio of 30.4% in 2015 was 7.6 points higher than the 2014
ratio of 22.8%. Net favorable prior year reserve development in 2015 and 2014 provided 12.4 points
and 21.7 points of benefit, respectively, to the loss and loss adjustment expense ratio. Catastrophe
losses in 2015 and 2014 accounted for 0.2 points and 0.3 points of the loss and loss adjustment expense
ratio, respectively. The 2015 underlying loss and loss adjustment expense ratio was 1.6 points lower
than the 2014 ratio on the same basis, primarily reflecting lower loss estimates in certain management
liability businesses.
The underwriting expense ratio of 37.5% in 2015 was 0.5 points lower than the underwriting
expense ratio of 38.0% in 2014, primarily reflecting the impact of lower general and administrative
expenses discussed above.
The combined ratio of 60.8% in 2014 was 12.6 points lower than the combined ratio of 73.4% in
2013.
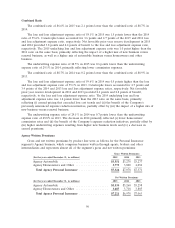
The loss and loss adjustment expense ratio of 22.8% in 2014 was 11.9 points lower than the loss
and loss adjustment expense ratio of 34.7% in 2013. Net favorable prior year reserve development in
2014 and 2013 provided 21.7 points and 11.7 points of benefit, respectively, to the loss and loss
adjustment expense ratio. Catastrophe losses in 2014 and 2013 accounted for 0.3 points and 0.4 points,
respectively, of the loss and loss adjustment expense ratio. The underlying loss and loss adjustment
expense ratio in 2014 was 1.8 points lower than the 2013 ratio on the same basis, primarily reflecting
the impact of increases in earned premiums largely due to lower reinsurance costs.
The underwriting expense ratio of 38.0% in 2014 was 0.7 points lower than the underwriting
expense ratio of 38.7% in 2013. The improvement in 2014 primarily reflected the impact of increases in
earned premiums largely due to lower reinsurance costs.
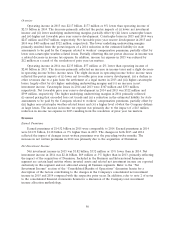
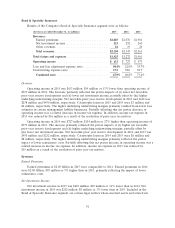
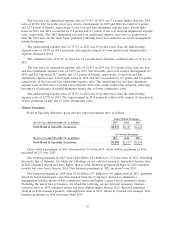
Written Premiums
Bond & Specialty Insurance gross and net written premiums were as follows:
Gross Written Premiums
(for the year ended December 31, in millions) 2015 2014 2013
Total Bond & Specialty Insurance .................. $2,153 $2,165 $2,131
Net Written Premiums
(for the year ended December 31, in millions) 2015 2014 2013
Total Bond & Specialty Insurance .................. $2,081 $2,103 $2,030
Gross written premiums in 2015 decreased by 1% from 2014. Gross written premiums in 2014
increased by 2% over 2013.
Net written premiums in 2015 were $2.08 billion, $22 million or 1% lower than in 2014. Excluding
the surety line of business, for which the following are not relevant measures, business retention rates
in 2015 remained strong and were higher than in 2014. Renewal premium changes in 2015 remained
positive but were lower than in 2014. New business premiums in 2015 increased over 2014.
Net written premiums in 2014 were $2.10 billion, $73 million or 4% higher than in 2013, primarily
driven by lower reinsurance costs that resulted from the Company’s decision to eliminate a
management liability excess-of-loss reinsurance treaty and higher contract surety premium volume.
Excluding the surety line of business, for which the following are not relevant measures, business
retention rates in 2014 remained strong and were slightly higher than in 2013. Renewal premium
changes in 2014 remained positive, although lower than in 2013, driven by renewal rate changes. New
business premiums in 2014 decreased from 2013.
93