Travelers 2015 Annual Report Download - page 140
Download and view the complete annual report
Please find page 140 of the 2015 Travelers annual report below. You can navigate through the pages in the report by either clicking on the pages listed below, or by using the keyword search tool below to find specific information within the annual report.-
 1
1 -
2
-
3
-
4
-
5
-
6
-
7
-
8
-
9
-
10
-
11
-
12
-
13
-
14
-
15
-
16
-
17
-
18
-
19
-
20
-
21
-
22
-
23
-
24
-
25
-
26
-
27
-
28
-
29
-
30
-
31
-
32
-
33
-
34
-
35
-
36
-
37
-
38
-
39
-
40
-
41
-
42
-
43
-
44
-
45
-
46
-
47
-
48
-
49
-
50
-
51
-
52
-
53
-
54
-
55
-
56
-
57
-
58
-
59
-
60
-
61
-
62
-
63
-
64
-
65
-
66
-
67
-
68
-
69
-
70
-
71
-
72
-
73
-
74
-
75
-
76
-
77
-
78
-
79
-
80
-
81
-
82
-
83
-
84
-
85
-
86
-
87
-
88
-
89
-
90
-
91
-
92
-
93
-
94
-
95
-
96
-
97
-
98
-
99
-
100
-
101
-
102
-
103
-
104
-
105
-
106
-
107
-
108
-
109
-
110
-
111
-
112
-
113
-
114
-
115
-
116
-
117
-
118
-
119
-
120
-
121
-
122
-
123
-
124
-
125
-
126
-
127
-
128
-
129
-
 130
130 -
 131
131 -
 132
132 -
 133
133 -
 134
134 -
 135
135 -
 136
136 -
 137
137 -
 138
138 -
 139
139 -
 140
140 -
 141
141 -
 142
142 -
 143
143 -
 144
144 -
 145
145 -
 146
146 -
 147
147 -
 148
148 -
 149
149 -
 150
150 -
151
-
152
-
153
-
154
-
155
-
156
-
157
-
158
-
159
-
160
-
161
-
162
-
163
-
164
-
165
-
166
-
167
-
168
-
169
-
170
-
171
-
172
-
173
-
174
-
175
-
176
-
177
-
178
-
179
-
180
-
181
-
182
-
183
-
184
-
185
-
186
-
187
-
188
-
189
-
190
-
191
-
192
-
193
-
194
-
195
-
196
-
197
-
198
-
199
-
200
-
201
-
202
-
203
-
204
-
205
-
206
-
207
-
208
-
209
-
210
-
211
-
212
-
213
-
214
-
215
-
216
-
217
-
218
-
219
-
220
-
221
-
222
-
223
-
224
-
225
-
226
-
227
-
228
-
229
-
230
-
231
-
232
-
233
-
234
-
235
-
236
-
237
-
238
-
239
-
240
-
241
-
242
-
243
-
244
-
245
-
246
-
247
-
248
-
249
-
250
-
251
-
252
-
253
-
254
-
255
-
256
-
257
-
258
-
259
-
260
-
261
-
262
-
263
-
264
-
265
-
266
-
267
-
268
-
269
-
270
-
271
-
272
-
273
-
274
-
275
-
276
-
277
-
278
-
279
-
280
-
281
-
282
-
283
-
284
-
285
-
286
-
287
 |
 |

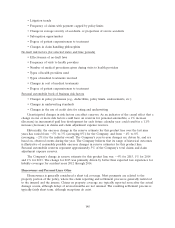
• Changes in policy provisions or court interpretation of such provisions
• New or expanded theories of liability
• Trends in jury awards
• Changes in the propensity to sue, in general with specificity to particular issues
• Changes in the propensity to litigate rather than settle a claim
• Changes in statutes of limitations
• Changes in the underlying court system
• Distortions from losses resulting from large single accounts or single issues
• Changes in tort law
• Shifts in lawsuit mix between federal and state courts
• Changes in claim adjuster office structure (causing distortions in the data)
• The potential impact of inflation on loss costs
• Changes in settlement patterns
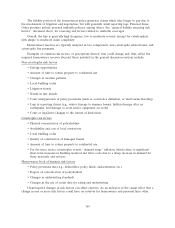
General liability book of business risk factors
• Changes in policy provisions (e.g., deductibles, policy limits, endorsements)
• Changes in underwriting standards
• Product mix (e.g., size of account, industries insured, jurisdiction mix)
Unanticipated changes in risk factors can affect reserves. As an indicator of the causal effect that a
change in one or more risk factors could have on reserves for general liability (excluding asbestos and
environmental), a 1% increase (decrease) in incremental paid loss development for each future
calendar year could result in a 1.5% increase (decrease) in claims and claim adjustment expense
reserves.
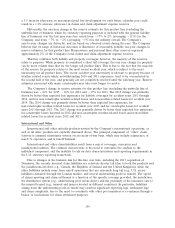
Historically, the one-year change in the reserve estimate for this product line, excluding estimated
asbestos and environmental amounts, over the last nine years has varied from 8% to 2%
(averaging 4%) for the Company, and from 5% to 2% (averaging 3%) for the industry overall.
The Company’s year-to-year changes are driven by, and are based on, observed events during the year.
The Company believes that its range of historical outcomes is illustrative of reasonably possible
one-year changes in reserve estimates for this product line. General liability reserves (excluding
asbestos and environmental) represent approximately 22% of the Company’s total claims and claim
adjustment expense reserves.
The Company’s change in reserve estimate for this product line, excluding estimated asbestos and
environmental amounts, was 3% for 2015, 5% for 2014 and 4% for 2013. The 2015 change was
primarily concentrated in excess coverages for accident years 2005 through 2013, reflecting a more
favorable legal environment than what the Company previously expected. The 2014 change was
primarily concentrated in excess coverages for accident years 2008 through 2012, reflecting a more
favorable legal environment than what the Company previously expected. The 2013 change was
primarily concentrated in excess coverages for accident years 2010 and prior, reflecting a more
favorable legal environment than what the Company previously expected.
140