Travelers 2015 Annual Report Download - page 11
Download and view the complete annual report
Please find page 11 of the 2015 Travelers annual report below. You can navigate through the pages in the report by either clicking on the pages listed below, or by using the keyword search tool below to find specific information within the annual report.-
 1
1 -
 2
2 -
 3
3 -
 4
4 -
 5
5 -
 6
6 -
 7
7 -
 8
8 -
 9
9 -
 10
10 -
 11
11 -
 12
12 -
 13
13 -
 14
14 -
 15
15 -
 16
16 -
 17
17 -
 18
18 -
 19
19 -
 20
20 -
 21
21 -
 22
22 -
23
-
24
-
25
-
26
-
27
-
28
-
29
-
30
-
31
-
32
-
33
-
34
-
35
-
36
-
37
-
38
-
39
-
40
-
41
-
42
-
43
-
44
-
45
-
46
-
47
-
48
-
49
-
50
-
51
-
52
-
53
-
54
-
55
-
56
-
57
-
58
-
59
-
60
-
61
-
62
-
63
-
64
-
65
-
66
-
67
-
68
-
69
-
70
-
71
-
72
-
73
-
74
-
75
-
76
-
77
-
78
-
79
-
80
-
81
-
82
-
83
-
84
-
85
-
86
-
87
-
88
-
89
-
90
-
91
-
92
-
93
-
94
-
95
-
96
-
97
-
98
-
99
-
100
-
101
-
102
-
103
-
104
-
105
-
106
-
107
-
108
-
109
-
110
-
111
-
112
-
113
-
114
-
115
-
116
-
117
-
118
-
119
-
120
-
121
-
122
-
123
-
124
-
125
-
126
-
127
-
128
-
129
-
130
-
131
-
132
-
133
-
134
-
135
-
136
-
137
-
138
-
139
-
140
-
141
-
142
-
143
-
144
-
145
-
146
-
147
-
148
-
149
-
150
-
151
-
152
-
153
-
154
-
155
-
156
-
157
-
158
-
159
-
160
-
161
-
162
-
163
-
164
-
165
-
166
-
167
-
168
-
169
-
170
-
171
-
172
-
173
-
174
-
175
-
176
-
177
-
178
-
179
-
180
-
181
-
182
-
183
-
184
-
185
-
186
-
187
-
188
-
189
-
190
-
191
-
192
-
193
-
194
-
195
-
196
-
197
-
198
-
199
-
200
-
201
-
202
-
203
-
204
-
205
-
206
-
207
-
208
-
209
-
210
-
211
-
212
-
213
-
214
-
215
-
216
-
217
-
218
-
219
-
220
-
221
-
222
-
223
-
224
-
225
-
226
-
227
-
228
-
229
-
230
-
231
-
232
-
233
-
234
-
235
-
236
-
237
-
238
-
239
-
240
-
241
-
242
-
243
-
244
-
245
-
246
-
247
-
248
-
249
-
250
-
251
-
252
-
253
-
254
-
255
-
256
-
257
-
258
-
259
-
260
-
261
-
262
-
263
-
264
-
265
-
266
-
267
-
268
-
269
-
270
-
271
-
272
-
273
-
274
-
275
-
276
-
277
-
278
-
279
-
280
-
281
-
282
-
283
-
284
-
285
-
286
-
287
 |
 |

liabilities for airline, aerospace, general aviation, aviation war and space risks. Personal accident
provides financial protection in the event of death or disablement due to accidental bodily
injury, while kidnap & ransom provides financial protection against kidnap, hijack, illegal
detention and extortion. While the covered hazards may be similar to those in the U.S. market,
the different legal environments can make the product risks and coverage terms potentially very
different from those the Company faces in the United States.
Net Retention Policy Per Risk
The following discussion reflects the Company’s retention policy with respect to the Business and
International Insurance segment as of January 1, 2016. For third-party liability, Business and
International Insurance generally limits its net retention, through the use of reinsurance, to a maximum
of $16.0 million per insured, per occurrence. For property exposures, Business and International
Insurance generally limits its retained amount per risk to $20.0 million per occurrence, net of
reinsurance. Business and International Insurance generally retains its workers’ compensation
exposures. Reinsurance treaties often have aggregate limits or caps which may result in larger net per-
risk retentions if the aggregate limits or caps are reached. Business and International Insurance utilizes
facultative reinsurance to provide additional limits capacity or to reduce retentions on an individual risk
basis. Business and International Insurance may also retain amounts greater than those described
herein based upon the individual characteristics of the risk.
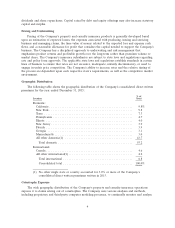
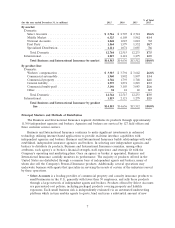
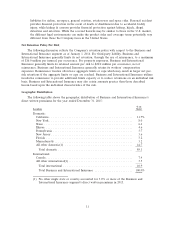
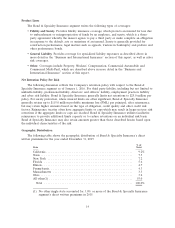
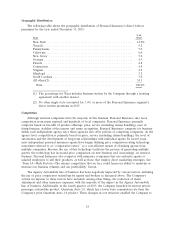
Geographic Distribution
The following table shows the geographic distribution of Business and International Insurance’s
direct written premiums for the year ended December 31, 2015:
% of
Location Total
Domestic:
California ................................................ 11.7%
New York ................................................ 8.0
Texas ................................................... 6.4
Illinois .................................................. 4.6
Pennsylvania .............................................. 3.7
New Jersey ............................................... 3.6
Florida .................................................. 3.2
Massachusetts ............................................. 3.2
All other domestic(1) ....................................... 44.7
Total domestic ........................................... 89.1
International:
Canada .................................................. 7.4
All other international(1) ..................................... 3.5
Total international ........................................ 10.9
Total Business and International Insurance ...................... 100.0%
(1) No other single state or country accounted for 3.0% or more of the Business and
International Insurance segment’s direct written premiums in 2015.
11