Travelers 2015 Annual Report Download - page 186
Download and view the complete annual report
Please find page 186 of the 2015 Travelers annual report below. You can navigate through the pages in the report by either clicking on the pages listed below, or by using the keyword search tool below to find specific information within the annual report.-
 1
1 -
2
-
3
-
4
-
5
-
6
-
7
-
8
-
9
-
10
-
11
-
12
-
13
-
14
-
15
-
16
-
17
-
18
-
19
-
20
-
21
-
22
-
23
-
24
-
25
-
26
-
27
-
28
-
29
-
30
-
31
-
32
-
33
-
34
-
35
-
36
-
37
-
38
-
39
-
40
-
41
-
42
-
43
-
44
-
45
-
46
-
47
-
48
-
49
-
50
-
51
-
52
-
53
-
54
-
55
-
56
-
57
-
58
-
59
-
60
-
61
-
62
-
63
-
64
-
65
-
66
-
67
-
68
-
69
-
70
-
71
-
72
-
73
-
74
-
75
-
76
-
77
-
78
-
79
-
80
-
81
-
82
-
83
-
84
-
85
-
86
-
87
-
88
-
89
-
90
-
91
-
92
-
93
-
94
-
95
-
96
-
97
-
98
-
99
-
100
-
101
-
102
-
103
-
104
-
105
-
106
-
107
-
108
-
109
-
110
-
111
-
112
-
113
-
114
-
115
-
116
-
117
-
118
-
119
-
120
-
121
-
122
-
123
-
124
-
125
-
126
-
127
-
128
-
129
-
130
-
131
-
132
-
133
-
134
-
135
-
136
-
137
-
138
-
139
-
140
-
141
-
142
-
143
-
144
-
145
-
146
-
147
-
148
-
149
-
150
-
151
-
152
-
153
-
154
-
155
-
156
-
157
-
158
-
159
-
160
-
161
-
162
-
163
-
164
-
165
-
166
-
167
-
168
-
169
-
170
-
171
-
172
-
173
-
174
-
175
-
 176
176 -
 177
177 -
 178
178 -
 179
179 -
 180
180 -
 181
181 -
 182
182 -
 183
183 -
 184
184 -
 185
185 -
 186
186 -
 187
187 -
 188
188 -
 189
189 -
 190
190 -
 191
191 -
 192
192 -
 193
193 -
 194
194 -
 195
195 -
 196
196 -
197
-
198
-
199
-
200
-
201
-
202
-
203
-
204
-
205
-
206
-
207
-
208
-
209
-
210
-
211
-
212
-
213
-
214
-
215
-
216
-
217
-
218
-
219
-
220
-
221
-
222
-
223
-
224
-
225
-
226
-
227
-
228
-
229
-
230
-
231
-
232
-
233
-
234
-
235
-
236
-
237
-
238
-
239
-
240
-
241
-
242
-
243
-
244
-
245
-
246
-
247
-
248
-
249
-
250
-
251
-
252
-
253
-
254
-
255
-
256
-
257
-
258
-
259
-
260
-
261
-
262
-
263
-
264
-
265
-
266
-
267
-
268
-
269
-
270
-
271
-
272
-
273
-
274
-
275
-
276
-
277
-
278
-
279
-
280
-
281
-
282
-
283
-
284
-
285
-
286
-
287
 |
 |

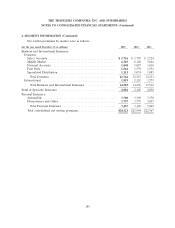
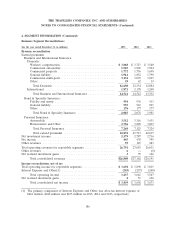
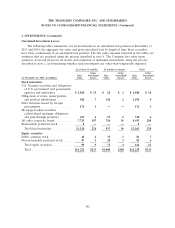
THE TRAVELERS COMPANIES, INC. AND SUBSIDIARIES
NOTES TO CONSOLIDATED FINANCIAL STATEMENTS (Continued)
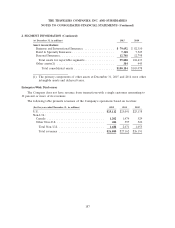
2. SEGMENT INFORMATION (Continued)
Business Segment Reconciliations
(for the year ended December 31, in millions) 2015 2014 2013
Revenue reconciliation
Earned premiums
Business and International Insurance:
Domestic:
Workers’ compensation ................................ $ 3,868 $ 3,713 $ 3,560
Commercial automobile ............................... 1,925 1,901 1,904
Commercial property ................................. 1,772 1,756 1,698
General liability ..................................... 1,914 1,852 1,790
Commercial multi-peril ................................ 3,132 3,070 3,093
Other ............................................ 39 42 39
Total Domestic .................................... 12,650 12,334 12,084
International ......................................... 1,871 2,178 1,248
Total Business and International Insurance ................ 14,521 14,512 13,332
Bond & Specialty Insurance:
Fidelity and surety ................................... 954 936 913
General liability ..................................... 955 963 891
Other ............................................ 176 177 177
Total Bond & Specialty Insurance ...................... 2,085 2,076 1,981
Personal Insurance:
Automobile ........................................ 3,512 3,316 3,431
Homeowners and Other ............................... 3,756 3,809 3,893
Total Personal Insurance ............................. 7,268 7,125 7,324
Total earned premiums .............................. 23,874 23,713 22,637
Net investment income ..................................... 2,379 2,787 2,716
Fee income ............................................. 445 438 395
Other revenues .......................................... 93 145 283
Total operating revenues for reportable segments .................. 26,791 27,083 26,031
Other revenues .......................................... 6—(6)
Net realized investment gains ................................ 379 166
Total consolidated revenues ............................ $26,800 $27,162 $26,191
Income reconciliation, net of tax
Total operating income for reportable segments ................... $ 3,692 $ 3,898 $ 3,815
Interest Expense and Other(1) ............................... (255) (257) (248)
Total operating income ................................ 3,437 3,641 3,567
Net realized investment gains ................................ 251 106
Total consolidated net income ........................... $ 3,439 $ 3,692 $ 3,673
(1) The primary component of Interest Expense and Other was after-tax interest expense of
$242 million, $240 million and $235 million in 2015, 2014 and 2013, respectively.
186