Travelers 2015 Annual Report Download - page 87
Download and view the complete annual report
Please find page 87 of the 2015 Travelers annual report below. You can navigate through the pages in the report by either clicking on the pages listed below, or by using the keyword search tool below to find specific information within the annual report.-
 1
1 -
2
-
3
-
4
-
5
-
6
-
7
-
8
-
9
-
10
-
11
-
12
-
13
-
14
-
15
-
16
-
17
-
18
-
19
-
20
-
21
-
22
-
23
-
24
-
25
-
26
-
27
-
28
-
29
-
30
-
31
-
32
-
33
-
34
-
35
-
36
-
37
-
38
-
39
-
40
-
41
-
42
-
43
-
44
-
45
-
46
-
47
-
48
-
49
-
50
-
51
-
52
-
53
-
54
-
55
-
56
-
57
-
58
-
59
-
60
-
61
-
62
-
63
-
64
-
65
-
66
-
67
-
68
-
69
-
70
-
71
-
72
-
73
-
74
-
75
-
76
-
 77
77 -
 78
78 -
 79
79 -
 80
80 -
 81
81 -
 82
82 -
 83
83 -
 84
84 -
 85
85 -
 86
86 -
 87
87 -
 88
88 -
 89
89 -
 90
90 -
 91
91 -
 92
92 -
 93
93 -
 94
94 -
 95
95 -
 96
96 -
 97
97 -
98
-
99
-
100
-
101
-
102
-
103
-
104
-
105
-
106
-
107
-
108
-
109
-
110
-
111
-
112
-
113
-
114
-
115
-
116
-
117
-
118
-
119
-
120
-
121
-
122
-
123
-
124
-
125
-
126
-
127
-
128
-
129
-
130
-
131
-
132
-
133
-
134
-
135
-
136
-
137
-
138
-
139
-
140
-
141
-
142
-
143
-
144
-
145
-
146
-
147
-
148
-
149
-
150
-
151
-
152
-
153
-
154
-
155
-
156
-
157
-
158
-
159
-
160
-
161
-
162
-
163
-
164
-
165
-
166
-
167
-
168
-
169
-
170
-
171
-
172
-
173
-
174
-
175
-
176
-
177
-
178
-
179
-
180
-
181
-
182
-
183
-
184
-
185
-
186
-
187
-
188
-
189
-
190
-
191
-
192
-
193
-
194
-
195
-
196
-
197
-
198
-
199
-
200
-
201
-
202
-
203
-
204
-
205
-
206
-
207
-
208
-
209
-
210
-
211
-
212
-
213
-
214
-
215
-
216
-
217
-
218
-
219
-
220
-
221
-
222
-
223
-
224
-
225
-
226
-
227
-
228
-
229
-
230
-
231
-
232
-
233
-
234
-
235
-
236
-
237
-
238
-
239
-
240
-
241
-
242
-
243
-
244
-
245
-
246
-
247
-
248
-
249
-
250
-
251
-
252
-
253
-
254
-
255
-
256
-
257
-
258
-
259
-
260
-
261
-
262
-
263
-
264
-
265
-
266
-
267
-
268
-
269
-
270
-
271
-
272
-
273
-
274
-
275
-
276
-
277
-
278
-
279
-
280
-
281
-
282
-
283
-
284
-
285
-
286
-
287
 |
 |
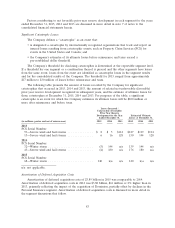
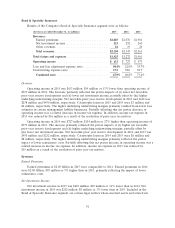
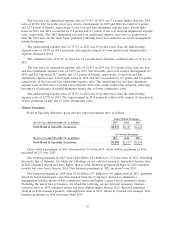
Fee Income
National Accounts is the primary source of fee income due to its service businesses, which include
claim and loss prevention services to large companies that choose to self-insure a portion of their
insurance risks, as well as claims and policy management services to workers’ compensation residual
market pools. Fee income in 2015 was $445 million, $7 million or 2% higher than in 2014. Fee income
in 2014 was $438 million, $43 million or 11% higher than in 2013. The increases in both years primarily
reflected higher serviced premium volume in workers’ compensation residual market pools and higher
claim volume in the large deductible business.
Other Revenues
Other revenues in 2013 included a $91 million gain from the settlement of a legal proceeding,
which is discussed in more detail in note 16 of notes to the consolidated financial statements herein.
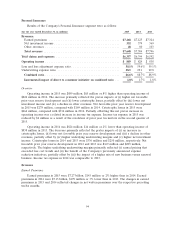
Claims and Expenses
Claims and Claim Adjustment Expenses
Claims and claim adjustment expenses in 2015 were $8.86 billion, $286 million or 3% lower than in
2014. The decrease primarily reflected (i) lower catastrophe losses, (ii) higher net favorable prior year
reserve development and (iii) lower non-catastrophe weather-related losses, partially offset by (iv) the
impact of loss cost trends. Claims and claim adjustment expenses in 2014 were $9.15 billion,
$860 million or 10% higher than in 2013. The increase primarily reflected (i) the impact of the
acquisition of Dominion, (ii) the impact of loss cost trends, (iii) higher non-catastrophe weather-related
losses, (iv) a higher level of what the Company defines as large losses, (v) lower net favorable prior
year reserve development and (vi) higher catastrophe losses, partially offset by (vii) the impact of lower
volumes of insured exposures (excluding the impact of the acquisition of Dominion). Factors
contributing to net favorable prior year reserve development during the years ended December 31,
2015, 2014 and 2013 are discussed in more detail in note 7 of notes to the consolidated financial
statements herein.
Amortization of Deferred Acquisition Costs
Amortization of deferred acquisition costs of $2.33 billion in 2015 was comparable to 2014.
Amortization of deferred acquisition costs in 2014 was $2.32 billion, $163 million or 8% higher than in
2013, primarily reflecting the impact of the acquisition of Dominion.
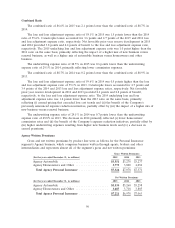
General and Administrative Expenses
General and administrative expenses in 2015 were $2.69 billion, $145 million or 6% higher than in
2014, primarily reflecting the impacts of the 2014 reduction in the estimated liability for state
assessments to be paid by the Company related to workers’ compensation premiums, higher technology
and employee related expenses and higher contingent commissions. General and administrative
expenses in 2014 were $2.54 billion, $172 million or 7% higher than in 2013, primarily reflecting the
impact of the acquisition of Dominion and increases in employee and technology related expenses,
partially offset by a reduction in the estimated liability for state assessments primarily related to
workers’ compensation premiums.
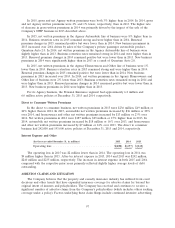
Income Tax Expense
Income tax expense in 2015 was $769 million, $29 million or 4% lower than in 2014, which
primarily resulted from the $206 million decrease in income before income taxes in 2015 and the
$12 million reduction in income tax expense in 2015 resulting from the resolution of prior year tax
87