Travelers 2015 Annual Report Download - page 123
Download and view the complete annual report
Please find page 123 of the 2015 Travelers annual report below. You can navigate through the pages in the report by either clicking on the pages listed below, or by using the keyword search tool below to find specific information within the annual report.-
 1
1 -
2
-
3
-
4
-
5
-
6
-
7
-
8
-
9
-
10
-
11
-
12
-
13
-
14
-
15
-
16
-
17
-
18
-
19
-
20
-
21
-
22
-
23
-
24
-
25
-
26
-
27
-
28
-
29
-
30
-
31
-
32
-
33
-
34
-
35
-
36
-
37
-
38
-
39
-
40
-
41
-
42
-
43
-
44
-
45
-
46
-
47
-
48
-
49
-
50
-
51
-
52
-
53
-
54
-
55
-
56
-
57
-
58
-
59
-
60
-
61
-
62
-
63
-
64
-
65
-
66
-
67
-
68
-
69
-
70
-
71
-
72
-
73
-
74
-
75
-
76
-
77
-
78
-
79
-
80
-
81
-
82
-
83
-
84
-
85
-
86
-
87
-
88
-
89
-
90
-
91
-
92
-
93
-
94
-
95
-
96
-
97
-
98
-
99
-
100
-
101
-
102
-
103
-
104
-
105
-
106
-
107
-
108
-
109
-
110
-
111
-
112
-
 113
113 -
 114
114 -
 115
115 -
 116
116 -
 117
117 -
 118
118 -
 119
119 -
 120
120 -
 121
121 -
 122
122 -
 123
123 -
 124
124 -
 125
125 -
 126
126 -
 127
127 -
 128
128 -
 129
129 -
 130
130 -
 131
131 -
 132
132 -
 133
133 -
134
-
135
-
136
-
137
-
138
-
139
-
140
-
141
-
142
-
143
-
144
-
145
-
146
-
147
-
148
-
149
-
150
-
151
-
152
-
153
-
154
-
155
-
156
-
157
-
158
-
159
-
160
-
161
-
162
-
163
-
164
-
165
-
166
-
167
-
168
-
169
-
170
-
171
-
172
-
173
-
174
-
175
-
176
-
177
-
178
-
179
-
180
-
181
-
182
-
183
-
184
-
185
-
186
-
187
-
188
-
189
-
190
-
191
-
192
-
193
-
194
-
195
-
196
-
197
-
198
-
199
-
200
-
201
-
202
-
203
-
204
-
205
-
206
-
207
-
208
-
209
-
210
-
211
-
212
-
213
-
214
-
215
-
216
-
217
-
218
-
219
-
220
-
221
-
222
-
223
-
224
-
225
-
226
-
227
-
228
-
229
-
230
-
231
-
232
-
233
-
234
-
235
-
236
-
237
-
238
-
239
-
240
-
241
-
242
-
243
-
244
-
245
-
246
-
247
-
248
-
249
-
250
-
251
-
252
-
253
-
254
-
255
-
256
-
257
-
258
-
259
-
260
-
261
-
262
-
263
-
264
-
265
-
266
-
267
-
268
-
269
-
270
-
271
-
272
-
273
-
274
-
275
-
276
-
277
-
278
-
279
-
280
-
281
-
282
-
283
-
284
-
285
-
286
-
287
 |
 |
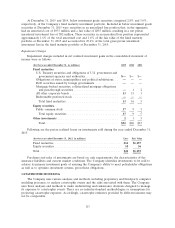
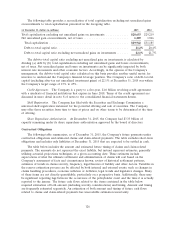
Operating Activities
Net cash flows provided by operating activities were $3.43 billion, $3.69 billion and $3.82 billion in
2015, 2014 and 2013, respectively. Cash flows in 2015 reflected a higher level of losses and loss
adjustment expenses paid as a result of the Company’s $579 million payment related to the settlement
of the Asbestos Direct Action Litigation as described in more detail in note 16 of notes to the
consolidated financial statements herein and a lower level of net investment income, partially offset by
a higher level of collected premiums and a lower contribution to the Company’s qualified domestic
pension plan. Cash flows in 2014 primarily reflected higher levels of payments for claims and claim
adjustment expenses, general and administrative expenses and commission expenses, as well as higher
income tax payments, partially offset by higher levels of collected premiums. These increases included
the impact of the Company’s acquisition of Dominion. Cash flows in 2013 primarily reflected a
decrease in losses paid related to catastrophes and a higher level of collected premiums, partially offset
by an increase in income tax payments. In 2015 and 2014, the Company voluntarily made contributions
totaling $100 million and $200 million, respectively, to its qualified domestic pension plan. In 2013, the
Company made no contributions to its qualified domestic pension plan. The qualified domestic pension
plan was 96% funded at both December 31, 2015 and 2014.
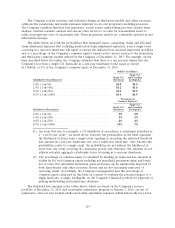
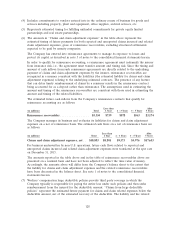
Investing Activities
Net cash provided by investing activities was $317 million in 2015, compared with net cash flows
provided by investing activities of $206 million in 2014 and net cash flows used in investing activities of
$910 million in 2013. The 2013 total included $997 million related to the Company’s acquisition of
Dominion (net of cash acquired). The Company’s consolidated total investments at December 31, 2015
decreased by $2.79 billion, or 4% from year-end 2014, primarily reflecting a decrease in the unrealized
appreciation of investments, common share repurchases, the impact of changes in foreign currency
exchange rates and dividends paid to shareholders, partially offset by net cash flows provided by
operating activities. The Company’s consolidated total investments at December 31, 2014 increased by
$101 million, or less than 1% over year-end 2013, primarily reflecting the impact of net cash flows
provided by operating activities and an increase in net unrealized appreciation of investments, largely
offset by common share repurchases and dividends paid to shareholders.
The Company’s investment portfolio is managed to support its insurance operations; accordingly,
the portfolio is positioned to meet obligations to policyholders. As such, the primary goals of the
Company’s asset-liability management process are to satisfy the insurance liabilities and maintain
sufficient liquidity to cover fluctuations in projected liability cash flows. Generally, the expected
principal and interest payments produced by the Company’s fixed maturity portfolio adequately fund
the estimated runoff of the Company’s insurance reserves. Although this is not an exact cash flow
match in each period, the substantial amount by which the market value of the fixed maturity portfolio
exceeds the value of the net insurance liabilities, as well as the positive cash flow from newly sold
policies and the large amount of high quality liquid bonds, contributes to the Company’s ability to fund
claim payments without having to sell illiquid assets or access credit facilities.
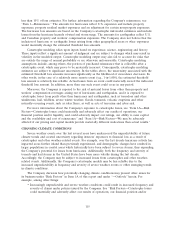
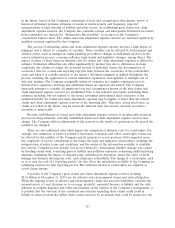
Financing Activities
Net cash flows used in financing activities were $3.73 billion, $3.81 billion and $2.94 billion in 2015,
2014 and 2013, respectively. The totals in each year primarily reflected common share repurchases and
dividends to shareholders, partially offset by the proceeds from employee stock option exercises. The
total in 2015 also included the issuance of 4.30% senior notes for net proceeds of $392 million and the
payment of the Company’s $400 million, 5.50% senior notes at maturity. The total in 2013 also
included the issuance of 4.60% senior notes for net proceeds of $494 million and the payment of the
Company’s $500 million, 5.00% senior notes at maturity. Common share repurchases in 2015, 2014 and
2013 were $3.22 billion, $3.33 billion and $2.46 billion, respectively.
123