Travelers 2015 Annual Report Download - page 94
Download and view the complete annual report
Please find page 94 of the 2015 Travelers annual report below. You can navigate through the pages in the report by either clicking on the pages listed below, or by using the keyword search tool below to find specific information within the annual report.-
 1
1 -
2
-
3
-
4
-
5
-
6
-
7
-
8
-
9
-
10
-
11
-
12
-
13
-
14
-
15
-
16
-
17
-
18
-
19
-
20
-
21
-
22
-
23
-
24
-
25
-
26
-
27
-
28
-
29
-
30
-
31
-
32
-
33
-
34
-
35
-
36
-
37
-
38
-
39
-
40
-
41
-
42
-
43
-
44
-
45
-
46
-
47
-
48
-
49
-
50
-
51
-
52
-
53
-
54
-
55
-
56
-
57
-
58
-
59
-
60
-
61
-
62
-
63
-
64
-
65
-
66
-
67
-
68
-
69
-
70
-
71
-
72
-
73
-
74
-
75
-
76
-
77
-
78
-
79
-
80
-
81
-
82
-
83
-
 84
84 -
 85
85 -
 86
86 -
 87
87 -
 88
88 -
 89
89 -
 90
90 -
 91
91 -
 92
92 -
 93
93 -
 94
94 -
 95
95 -
 96
96 -
 97
97 -
 98
98 -
 99
99 -
 100
100 -
 101
101 -
 102
102 -
 103
103 -
 104
104 -
105
-
106
-
107
-
108
-
109
-
110
-
111
-
112
-
113
-
114
-
115
-
116
-
117
-
118
-
119
-
120
-
121
-
122
-
123
-
124
-
125
-
126
-
127
-
128
-
129
-
130
-
131
-
132
-
133
-
134
-
135
-
136
-
137
-
138
-
139
-
140
-
141
-
142
-
143
-
144
-
145
-
146
-
147
-
148
-
149
-
150
-
151
-
152
-
153
-
154
-
155
-
156
-
157
-
158
-
159
-
160
-
161
-
162
-
163
-
164
-
165
-
166
-
167
-
168
-
169
-
170
-
171
-
172
-
173
-
174
-
175
-
176
-
177
-
178
-
179
-
180
-
181
-
182
-
183
-
184
-
185
-
186
-
187
-
188
-
189
-
190
-
191
-
192
-
193
-
194
-
195
-
196
-
197
-
198
-
199
-
200
-
201
-
202
-
203
-
204
-
205
-
206
-
207
-
208
-
209
-
210
-
211
-
212
-
213
-
214
-
215
-
216
-
217
-
218
-
219
-
220
-
221
-
222
-
223
-
224
-
225
-
226
-
227
-
228
-
229
-
230
-
231
-
232
-
233
-
234
-
235
-
236
-
237
-
238
-
239
-
240
-
241
-
242
-
243
-
244
-
245
-
246
-
247
-
248
-
249
-
250
-
251
-
252
-
253
-
254
-
255
-
256
-
257
-
258
-
259
-
260
-
261
-
262
-
263
-
264
-
265
-
266
-
267
-
268
-
269
-
270
-
271
-
272
-
273
-
274
-
275
-
276
-
277
-
278
-
279
-
280
-
281
-
282
-
283
-
284
-
285
-
286
-
287
 |
 |

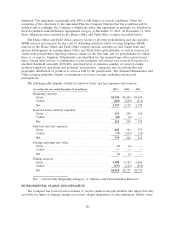
Personal Insurance
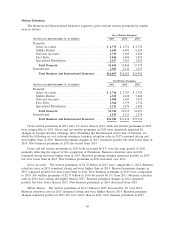
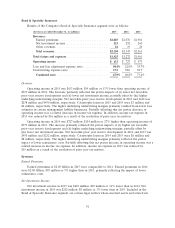
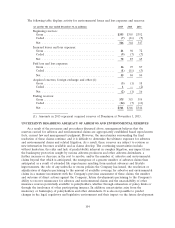
Results of the Company’s Personal Insurance segment were as follows:
(for the year ended December 31, in millions) 2015 2014 2013
Revenues:
Earned premiums ......................................... $7,268 $7,125 $7,324
Net investment income ...................................... 332 379 369
Other revenues ........................................... 48 80 103
Total revenues ............................................ $7,648 $7,584 $7,796
Total claims and expenses ..................................... $6,357 $6,394 $6,592
Operating income ........................................... $ 889 $ 824 $ 838
Loss and loss adjustment expense ratio ............................ 58.1% 59.6% 59.1%
Underwriting expense ratio .................................... 28.5 29.1 29.8
Combined ratio ........................................... 86.6% 88.7% 88.9%
Incremental impact of direct to consumer initiative on combined ratio ... 1.8% 1.7% 1.8%
Overview
Operating income in 2015 was $889 million, $65 million or 8% higher than operating income of
$824 million in 2014. The increase primarily reflected the pretax impacts of (i) higher net favorable
prior year reserve development and (ii) lower catastrophe losses, partially offset by (iii) lower net
investment income and (iv) a decline in other revenues. Net favorable prior year reserve development
in 2015 was $278 million, compared with $169 million in 2014. Catastrophe losses in 2015 were
$264 million, compared with $336 million in 2014. Partially offsetting this net pretax increase in
operating income was a related increase in income tax expense. Income tax expense in 2015 was
reduced by $4 million as a result of the resolution of prior year tax matters in the second quarter of
2015.
Operating income in 2014 was $824 million, $14 million or 2% lower than operating income of
$838 million in 2013. The decrease primarily reflected the pretax impacts of (i) an increase in
catastrophe losses, (ii) lower net favorable prior year reserve development and (iii) a decline in other
revenues, partially offset by (iv) higher underlying underwriting margins and (v) higher net investment
income. Catastrophe losses in 2014 and 2013 were $336 million and $250 million, respectively. Net
favorable prior year reserve development in 2014 and 2013 was $169 million and $209 million,
respectively. The higher underlying underwriting margins primarily reflected (i) earned pricing that
exceeded loss cost trends and (ii) the benefit of the Company’s previously announced expense
reduction initiatives, partially offset by (iii) the impact of a higher mix of new business versus renewal
business. Income tax expense in 2014 was comparable to 2013.
Revenues
Earned Premiums
Earned premiums in 2015 were $7.27 billion, $143 million or 2% higher than in 2014. Earned
premiums in 2014 were $7.13 billion, $199 million or 3% lower than in 2013. The changes in earned
premiums in 2015 and 2014 reflected changes in net written premiums over the respective preceding
twelve months.
94