Travelers 2015 Annual Report Download - page 110
Download and view the complete annual report
Please find page 110 of the 2015 Travelers annual report below. You can navigate through the pages in the report by either clicking on the pages listed below, or by using the keyword search tool below to find specific information within the annual report.-
 1
1 -
2
-
3
-
4
-
5
-
6
-
7
-
8
-
9
-
10
-
11
-
12
-
13
-
14
-
15
-
16
-
17
-
18
-
19
-
20
-
21
-
22
-
23
-
24
-
25
-
26
-
27
-
28
-
29
-
30
-
31
-
32
-
33
-
34
-
35
-
36
-
37
-
38
-
39
-
40
-
41
-
42
-
43
-
44
-
45
-
46
-
47
-
48
-
49
-
50
-
51
-
52
-
53
-
54
-
55
-
56
-
57
-
58
-
59
-
60
-
61
-
62
-
63
-
64
-
65
-
66
-
67
-
68
-
69
-
70
-
71
-
72
-
73
-
74
-
75
-
76
-
77
-
78
-
79
-
80
-
81
-
82
-
83
-
84
-
85
-
86
-
87
-
88
-
89
-
90
-
91
-
92
-
93
-
94
-
95
-
96
-
97
-
98
-
99
-
 100
100 -
 101
101 -
 102
102 -
 103
103 -
 104
104 -
 105
105 -
 106
106 -
 107
107 -
 108
108 -
 109
109 -
 110
110 -
 111
111 -
 112
112 -
 113
113 -
 114
114 -
 115
115 -
 116
116 -
 117
117 -
 118
118 -
 119
119 -
 120
120 -
121
-
122
-
123
-
124
-
125
-
126
-
127
-
128
-
129
-
130
-
131
-
132
-
133
-
134
-
135
-
136
-
137
-
138
-
139
-
140
-
141
-
142
-
143
-
144
-
145
-
146
-
147
-
148
-
149
-
150
-
151
-
152
-
153
-
154
-
155
-
156
-
157
-
158
-
159
-
160
-
161
-
162
-
163
-
164
-
165
-
166
-
167
-
168
-
169
-
170
-
171
-
172
-
173
-
174
-
175
-
176
-
177
-
178
-
179
-
180
-
181
-
182
-
183
-
184
-
185
-
186
-
187
-
188
-
189
-
190
-
191
-
192
-
193
-
194
-
195
-
196
-
197
-
198
-
199
-
200
-
201
-
202
-
203
-
204
-
205
-
206
-
207
-
208
-
209
-
210
-
211
-
212
-
213
-
214
-
215
-
216
-
217
-
218
-
219
-
220
-
221
-
222
-
223
-
224
-
225
-
226
-
227
-
228
-
229
-
230
-
231
-
232
-
233
-
234
-
235
-
236
-
237
-
238
-
239
-
240
-
241
-
242
-
243
-
244
-
245
-
246
-
247
-
248
-
249
-
250
-
251
-
252
-
253
-
254
-
255
-
256
-
257
-
258
-
259
-
260
-
261
-
262
-
263
-
264
-
265
-
266
-
267
-
268
-
269
-
270
-
271
-
272
-
273
-
274
-
275
-
276
-
277
-
278
-
279
-
280
-
281
-
282
-
283
-
284
-
285
-
286
-
287
 |
 |

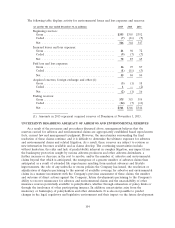
Debt Securities Corporate Securities
Issued
by Foreign Sovereign
Governments Financial Corporates All Other
Average Average Average Average
Carrying Credit Carrying Credit Carrying Credit Carrying Credit
(at December 31, 2015, in millions) Value Quality(1) Value Quality(1) Value Quality(1) Value Quality(1)
Eurozone Periphery
Spain ................... $ — — $ 45 A3 $ — — $ 36 A3
Ireland .................. ——————66A3
Greece .................. ————————
Italy .................... ————————
Portugal ................. ————————
Subtotal ................ — 45 — 102
Eurozone Non-Periphery
Germany ................. 2 Aaa 12 A3 242 Aa1 327 A3
France .................. 100 Aa2 11 A2 3 Aa1 396 A2
Netherlands .............. — — 64 A1 107 Aa1 298 A2
Austria .................. — — — — 2 Aaa/Aa1 — —
Finland .................. 8 Aaa/Aa1 — — 3 Aaa/Aa1 — —
Belgium ................. — — — — — — 154 A3
Luxembourg .............. ——————85A2
Subtotal ................ 110 87 357 1,260
Total ................ $110 $132 $357 $1,362
(1) Rated using external rating agencies or by the Company when a public rating does not exist. The
table includes $379 million of short-term securities which have the highest ratings issued by
external rating agencies for short-term issuances. For purposes of this table, the short-term
securities, which are rated ‘‘A-1+’’ and/or ‘‘P-1,’’ are included as ‘‘Aaa’’ rated securities.
In addition to fixed maturities noted in the foregoing table, the Company has exposure totaling
$187 million to private equity limited partnerships and real estate partnerships (both of which are
included in other investments in the Company’s consolidated balance sheet) whose primary investing
focus is across Europe. The Company has unfunded commitments totaling $129 million to these
partnerships. The Company also has $5 million of non-redeemable preferred stock (included in equity
securities on the Company’s consolidated balance sheet) issued by companies in the Eurozone.
Mortgage-Backed Securities, Collateralized Mortgage Obligations and Pass-Through Securities
The Company’s fixed maturity investment portfolio at December 31, 2015 and 2014 included
$1.98 billion and $2.21 billion, respectively, of residential mortgage-backed securities, including
pass-through-securities and collateralized mortgage obligations (CMOs), all of which are subject to
prepayment risk (either shortening or lengthening of duration). While prepayment risk for securities
and its effect on income cannot be fully controlled, particularly when interest rates move dramatically,
the Company’s investment strategy generally favors securities that reduce this risk within expected
interest rate ranges. The Company makes investments in residential CMOs that are either guaranteed
by GNMA, FNMA or FHLMC, or if not guaranteed, are senior or super-senior positions within their
respective securitizations. Both guaranteed and non-guaranteed residential CMOs allocate the
distribution of payments from the underlying mortgages among different classes of bondholders. In
addition, non-guaranteed residential CMOs provide structures that allocate the impact of credit losses
to different classes of bondholders. Senior and super-senior CMOs are protected, to varying degrees,
110