Travelers 2015 Annual Report Download - page 198
Download and view the complete annual report
Please find page 198 of the 2015 Travelers annual report below. You can navigate through the pages in the report by either clicking on the pages listed below, or by using the keyword search tool below to find specific information within the annual report.-
 1
1 -
2
-
3
-
4
-
5
-
6
-
7
-
8
-
9
-
10
-
11
-
12
-
13
-
14
-
15
-
16
-
17
-
18
-
19
-
20
-
21
-
22
-
23
-
24
-
25
-
26
-
27
-
28
-
29
-
30
-
31
-
32
-
33
-
34
-
35
-
36
-
37
-
38
-
39
-
40
-
41
-
42
-
43
-
44
-
45
-
46
-
47
-
48
-
49
-
50
-
51
-
52
-
53
-
54
-
55
-
56
-
57
-
58
-
59
-
60
-
61
-
62
-
63
-
64
-
65
-
66
-
67
-
68
-
69
-
70
-
71
-
72
-
73
-
74
-
75
-
76
-
77
-
78
-
79
-
80
-
81
-
82
-
83
-
84
-
85
-
86
-
87
-
88
-
89
-
90
-
91
-
92
-
93
-
94
-
95
-
96
-
97
-
98
-
99
-
100
-
101
-
102
-
103
-
104
-
105
-
106
-
107
-
108
-
109
-
110
-
111
-
112
-
113
-
114
-
115
-
116
-
117
-
118
-
119
-
120
-
121
-
122
-
123
-
124
-
125
-
126
-
127
-
128
-
129
-
130
-
131
-
132
-
133
-
134
-
135
-
136
-
137
-
138
-
139
-
140
-
141
-
142
-
143
-
144
-
145
-
146
-
147
-
148
-
149
-
150
-
151
-
152
-
153
-
154
-
155
-
156
-
157
-
158
-
159
-
160
-
161
-
162
-
163
-
164
-
165
-
166
-
167
-
168
-
169
-
170
-
171
-
172
-
173
-
174
-
175
-
176
-
177
-
178
-
179
-
180
-
181
-
182
-
183
-
184
-
185
-
186
-
187
-
 188
188 -
 189
189 -
 190
190 -
 191
191 -
 192
192 -
 193
193 -
 194
194 -
 195
195 -
 196
196 -
 197
197 -
 198
198 -
 199
199 -
 200
200 -
 201
201 -
 202
202 -
 203
203 -
 204
204 -
 205
205 -
 206
206 -
 207
207 -
 208
208 -
209
-
210
-
211
-
212
-
213
-
214
-
215
-
216
-
217
-
218
-
219
-
220
-
221
-
222
-
223
-
224
-
225
-
226
-
227
-
228
-
229
-
230
-
231
-
232
-
233
-
234
-
235
-
236
-
237
-
238
-
239
-
240
-
241
-
242
-
243
-
244
-
245
-
246
-
247
-
248
-
249
-
250
-
251
-
252
-
253
-
254
-
255
-
256
-
257
-
258
-
259
-
260
-
261
-
262
-
263
-
264
-
265
-
266
-
267
-
268
-
269
-
270
-
271
-
272
-
273
-
274
-
275
-
276
-
277
-
278
-
279
-
280
-
281
-
282
-
283
-
284
-
285
-
286
-
287
 |
 |
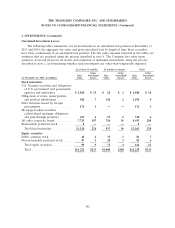
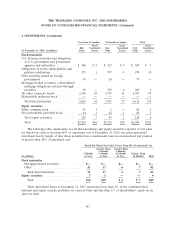
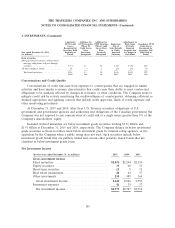
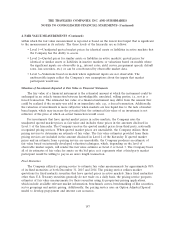
THE TRAVELERS COMPANIES, INC. AND SUBSIDIARIES
NOTES TO CONSOLIDATED FINANCIAL STATEMENTS (Continued)
4. FAIR VALUE MEASUREMENTS (Continued)
The pricing service evaluates each asset class based on relevant market information, relevant credit
information, perceived market movements and sector news. The market inputs utilized in the pricing
evaluation, listed in the approximate order of priority, include: benchmark yields, reported trades,
broker/dealer quotes, issuer spreads, two-sided markets, benchmark securities, bids, offers, reference
data, and industry and economic events. The extent of the use of each market input depends on the
asset class and the market conditions. Depending on the security, the priority of the use of inputs may
change or some market inputs may not be relevant. For some securities, additional inputs may be
necessary.
The pricing service utilized by the Company has indicated that it will only produce an estimate of
fair value if there is objectively verifiable information to produce a valuation. If the pricing service
discontinues pricing an investment, the Company would be required to produce an estimate of fair
value using some of the same methodologies as the pricing service but would have to make
assumptions for any market-based inputs that were unavailable due to market conditions. The Company
reviews the estimates of fair value provided by the pricing service and compares the estimates to the
Company’s knowledge of the market to determine if the estimates obtained are representative of the
prices in the market. In addition, the Company has periodic discussions with the pricing service to
discuss and understand any changes in process and their responsiveness to changes occurring in the
markets. In addition, the Company has implemented various other processes including randomly
selecting purchased or sold securities and comparing execution prices to the estimates from the pricing
service as well as reviewing reports that contain securities whose valuation did not change from their
previous valuation (stale price review). The Company also uses an additional independent pricing
service to further test the primary pricing service’s valuation of the Company’s fixed maturity portfolio.
The fair value estimates of most fixed maturity investments are based on observable market
information rather than market quotes. Accordingly, the estimates of fair value for such fixed
maturities, other than U.S. Treasury securities, provided by the pricing service are included in the
amount disclosed in Level 2 of the hierarchy. The estimated fair value of U.S. Treasury securities is
included in the amount disclosed in Level 1 as the estimates are based on unadjusted market prices.
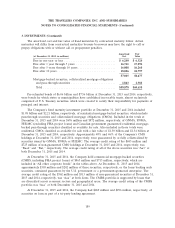
The Company also holds certain fixed maturity investments which are not priced by the pricing
service and, accordingly, estimates the fair value of such fixed maturities using an internal matrix that is
based on market information regarding interest rates, credit spreads and liquidity. The underlying
source data for calculating the matrix of credit spreads relative to the U.S. Treasury curve are the BofA
Merrill Lynch U.S. Corporate Index and the BofA Merrill Lynch High Yield BB Rated Index. The
Company includes the fair value estimates of these corporate bonds in Level 2, since all significant
inputs are market observable.
While the vast majority of the Company’s fixed maturities are included in Level 2, the Company
holds a number of municipal bonds and corporate bonds which are not valued by the pricing service
and estimates the fair value of these bonds using an internal pricing matrix with some unobservable
inputs that are significant to the valuation. Due to the limited amount of observable market
information, the Company includes the fair value estimates for these particular bonds in Level 3. The
fair value of the fixed maturities for which the Company used an internal pricing matrix was
$101 million and $92 million at December 31, 2015 and 2014, respectively. Additionally, the Company
holds a small amount of other fixed maturity investments that have characteristics that make them
unsuitable for matrix pricing. For these fixed maturities, the Company obtains a quote from a broker
198