Travelers 2015 Annual Report Download - page 108
Download and view the complete annual report
Please find page 108 of the 2015 Travelers annual report below. You can navigate through the pages in the report by either clicking on the pages listed below, or by using the keyword search tool below to find specific information within the annual report.-
 1
1 -
2
-
3
-
4
-
5
-
6
-
7
-
8
-
9
-
10
-
11
-
12
-
13
-
14
-
15
-
16
-
17
-
18
-
19
-
20
-
21
-
22
-
23
-
24
-
25
-
26
-
27
-
28
-
29
-
30
-
31
-
32
-
33
-
34
-
35
-
36
-
37
-
38
-
39
-
40
-
41
-
42
-
43
-
44
-
45
-
46
-
47
-
48
-
49
-
50
-
51
-
52
-
53
-
54
-
55
-
56
-
57
-
58
-
59
-
60
-
61
-
62
-
63
-
64
-
65
-
66
-
67
-
68
-
69
-
70
-
71
-
72
-
73
-
74
-
75
-
76
-
77
-
78
-
79
-
80
-
81
-
82
-
83
-
84
-
85
-
86
-
87
-
88
-
89
-
90
-
91
-
92
-
93
-
94
-
95
-
96
-
97
-
 98
98 -
 99
99 -
 100
100 -
 101
101 -
 102
102 -
 103
103 -
 104
104 -
 105
105 -
 106
106 -
 107
107 -
 108
108 -
 109
109 -
 110
110 -
 111
111 -
 112
112 -
 113
113 -
 114
114 -
 115
115 -
 116
116 -
 117
117 -
 118
118 -
119
-
120
-
121
-
122
-
123
-
124
-
125
-
126
-
127
-
128
-
129
-
130
-
131
-
132
-
133
-
134
-
135
-
136
-
137
-
138
-
139
-
140
-
141
-
142
-
143
-
144
-
145
-
146
-
147
-
148
-
149
-
150
-
151
-
152
-
153
-
154
-
155
-
156
-
157
-
158
-
159
-
160
-
161
-
162
-
163
-
164
-
165
-
166
-
167
-
168
-
169
-
170
-
171
-
172
-
173
-
174
-
175
-
176
-
177
-
178
-
179
-
180
-
181
-
182
-
183
-
184
-
185
-
186
-
187
-
188
-
189
-
190
-
191
-
192
-
193
-
194
-
195
-
196
-
197
-
198
-
199
-
200
-
201
-
202
-
203
-
204
-
205
-
206
-
207
-
208
-
209
-
210
-
211
-
212
-
213
-
214
-
215
-
216
-
217
-
218
-
219
-
220
-
221
-
222
-
223
-
224
-
225
-
226
-
227
-
228
-
229
-
230
-
231
-
232
-
233
-
234
-
235
-
236
-
237
-
238
-
239
-
240
-
241
-
242
-
243
-
244
-
245
-
246
-
247
-
248
-
249
-
250
-
251
-
252
-
253
-
254
-
255
-
256
-
257
-
258
-
259
-
260
-
261
-
262
-
263
-
264
-
265
-
266
-
267
-
268
-
269
-
270
-
271
-
272
-
273
-
274
-
275
-
276
-
277
-
278
-
279
-
280
-
281
-
282
-
283
-
284
-
285
-
286
-
287
 |
 |

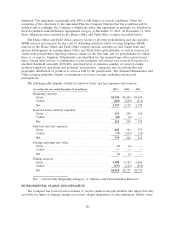
The following table shows the geographic distribution of the $25.35 billion of municipal bonds at
December 31, 2015 that were not pre-refunded.
State Local Total Average
General General Carrying Credit
(at December 31, 2015, in millions) Obligation Obligation Revenue Value Quality(1)
State:
Texas ................................ $ 139 $ 2,519 $1,077 $ 3,735 Aaa/Aa1
Virginia .............................. 120 789 914 1,823 Aaa/Aa1
Washington ........................... 119 1,029 568 1,716 Aa1
California ............................ 41 790 458 1,289 Aa1
Minnesota ............................ 151 871 98 1,120 Aaa/Aa1
North Carolina ......................... 78 660 297 1,035 Aaa/Aa1
Massachusetts ......................... 45 45 858 948 Aaa/Aa1
Maryland ............................. 129 535 204 868 Aaa/Aa1
Illinois ............................... 49 525 259 833 Aa1
Colorado ............................. — 567 233 800 Aa1
Georgia .............................. 133 475 144 752 Aaa/Aa1
Arizona .............................. — 410 329 739 Aa1
Wisconsin ............................ 175 297 243 715 Aa1
South Carolina ......................... 36 476 166 678 Aa1
New Jersey ........................... — 266 375 641 Aaa
Oregon .............................. 189 225 220 634 Aa1
All others(2)(3) ........................ 669 2,839 3,517 7,025 Aaa/Aa1
Total .............................. $2,073 $13,318 $9,960 $25,351 Aaa/Aa1
(1) Rated using external rating agencies or by the Company when a public rating does not exist.
Ratings shown are the higher of the rating of the underlying issuer or the insurer in the case of
securities enhanced by third-party insurance for the payment of principal and interest in the event
of issuer default.
(2) No other single state accounted for 2.5% or more of the total non-pre-refunded municipal bonds.
(3) The Company does not own any municipal securities issued by the city of Detroit, MI.
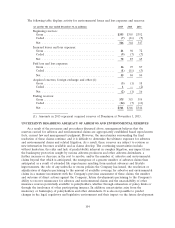
The following table displays the funding sources for the $9.96 billion of municipal bonds identified
as revenue bonds in the foregoing table at December 31, 2015.
Carrying Average Credit
(at December 31, 2015, in millions) Value Quality(1)
Source:
Water and sewer ............................... $3,722 Aaa/Aa1
Higher education .............................. 2,370 Aaa/Aa1
Power and utilities ............................. 1,001 Aa2
Transportation ................................ 928 Aa1
Special tax ................................... 670 Aa1
Lease ....................................... 115 Aa3
Housing ..................................... 101 Aaa/Aa1
Healthcare ................................... 39 Aa2
Property tax .................................. 12 Aa2
Other revenue sources ........................... 1,002 Aaa/Aa1
Total ...................................... $9,960 Aaa/Aa1
(1) Rated using external rating agencies or by the Company when a public rating does not
exist. Ratings shown are the higher of the rating of the underlying issuer or the insurer in
the case of securities enhanced by third-party insurance for the payment of principal and
interest in the event of issuer default.
108