Travelers 2015 Annual Report Download - page 79
Download and view the complete annual report
Please find page 79 of the 2015 Travelers annual report below. You can navigate through the pages in the report by either clicking on the pages listed below, or by using the keyword search tool below to find specific information within the annual report.-
 1
1 -
2
-
3
-
4
-
5
-
6
-
7
-
8
-
9
-
10
-
11
-
12
-
13
-
14
-
15
-
16
-
17
-
18
-
19
-
20
-
21
-
22
-
23
-
24
-
25
-
26
-
27
-
28
-
29
-
30
-
31
-
32
-
33
-
34
-
35
-
36
-
37
-
38
-
39
-
40
-
41
-
42
-
43
-
44
-
45
-
46
-
47
-
48
-
49
-
50
-
51
-
52
-
53
-
54
-
55
-
56
-
57
-
58
-
59
-
60
-
61
-
62
-
63
-
64
-
65
-
66
-
67
-
68
-
 69
69 -
 70
70 -
 71
71 -
 72
72 -
 73
73 -
 74
74 -
 75
75 -
 76
76 -
 77
77 -
 78
78 -
 79
79 -
 80
80 -
 81
81 -
 82
82 -
 83
83 -
 84
84 -
 85
85 -
 86
86 -
 87
87 -
 88
88 -
 89
89 -
90
-
91
-
92
-
93
-
94
-
95
-
96
-
97
-
98
-
99
-
100
-
101
-
102
-
103
-
104
-
105
-
106
-
107
-
108
-
109
-
110
-
111
-
112
-
113
-
114
-
115
-
116
-
117
-
118
-
119
-
120
-
121
-
122
-
123
-
124
-
125
-
126
-
127
-
128
-
129
-
130
-
131
-
132
-
133
-
134
-
135
-
136
-
137
-
138
-
139
-
140
-
141
-
142
-
143
-
144
-
145
-
146
-
147
-
148
-
149
-
150
-
151
-
152
-
153
-
154
-
155
-
156
-
157
-
158
-
159
-
160
-
161
-
162
-
163
-
164
-
165
-
166
-
167
-
168
-
169
-
170
-
171
-
172
-
173
-
174
-
175
-
176
-
177
-
178
-
179
-
180
-
181
-
182
-
183
-
184
-
185
-
186
-
187
-
188
-
189
-
190
-
191
-
192
-
193
-
194
-
195
-
196
-
197
-
198
-
199
-
200
-
201
-
202
-
203
-
204
-
205
-
206
-
207
-
208
-
209
-
210
-
211
-
212
-
213
-
214
-
215
-
216
-
217
-
218
-
219
-
220
-
221
-
222
-
223
-
224
-
225
-
226
-
227
-
228
-
229
-
230
-
231
-
232
-
233
-
234
-
235
-
236
-
237
-
238
-
239
-
240
-
241
-
242
-
243
-
244
-
245
-
246
-
247
-
248
-
249
-
250
-
251
-
252
-
253
-
254
-
255
-
256
-
257
-
258
-
259
-
260
-
261
-
262
-
263
-
264
-
265
-
266
-
267
-
268
-
269
-
270
-
271
-
272
-
273
-
274
-
275
-
276
-
277
-
278
-
279
-
280
-
281
-
282
-
283
-
284
-
285
-
286
-
287
 |
 |

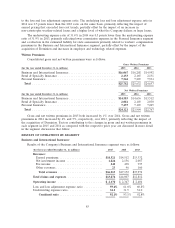
CONSOLIDATED OVERVIEW
Consolidated Results of Operations
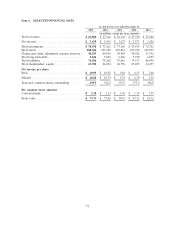
(for the year ended December 31, in millions except per share amounts) 2015 2014 2013
Revenues
Premiums .............................................. $23,874 $23,713 $22,637
Net investment income ..................................... 2,379 2,787 2,716
Fee income ............................................. 445 438 395
Net realized investment gains ................................ 379 166
Other revenues .......................................... 99 145 277
Total revenues ........................................ 26,800 27,162 26,191
Claims and expenses
Claims and claim adjustment expenses .......................... 13,723 13,870 13,307
Amortization of deferred acquisition costs ....................... 3,885 3,882 3,821
General and administrative expenses ........................... 4,079 3,952 3,757
Interest expense .......................................... 373 369 361
Total claims and expenses ............................... 22,060 22,073 21,246
Income before income taxes ................................ 4,740 5,089 4,945
Income tax expense ....................................... 1,301 1,397 1,272
Net income ............................................ $ 3,439 $ 3,692 $ 3,673
Net income per share
Basic ................................................ $ 10.99 $ 10.82 $ 9.84
Diluted .............................................. $ 10.88 $ 10.70 $ 9.74
Combined ratio
Loss and loss adjustment expense ratio ....................... 56.6% 57.6% 57.9%
Underwriting expense ratio ................................ 31.7 31.4 31.9
Combined ratio ..................................... 88.3% 89.0% 89.8%
Incremental impact of direct to consumer initiative on combined
ratio ........................................... 0.5% 0.6% 0.5%
The following discussions of the Company’s net income and segment operating income are
presented on an after-tax basis. Discussions of the components of net income and segment operating
income are presented on a pretax basis, unless otherwise noted. Discussions of earnings per common
share are presented on a diluted basis.
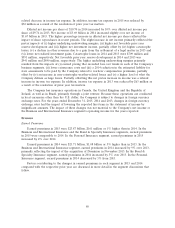
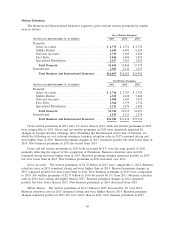
Overview
Diluted net income per share of $10.88 in 2015 increased by 2% over diluted net income per share
of $10.70 in 2014. Net income of $3.44 billion in 2015 decreased by 7% from net income of
$3.69 billion in 2014. The percentage increase in diluted net income per share compared with the
percentage decrease in net income reflected the impact of share repurchases in recent periods. The
decrease in net income primarily reflected the pretax impacts of (i) lower net investment income,
(ii) lower net realized investment gains, (iii) a decline in other revenues and (iv) slightly lower
underwriting margins excluding catastrophe losses and prior year reserve development (‘‘underlying
underwriting margins’’), partially offset by (v) lower catastrophe losses. Catastrophe losses in 2015 and
2014 were $514 million and $709 million, respectively. Net favorable prior year reserve development in
both 2015 and 2014 was $941 million. Partially offsetting this net pretax decrease in income was a
79